Chapter 25 Forest gap dynamics
The aim of this chapter is to explore forest gap dynamics in Paracou.
25.1 NCI-niche breadth
We specifically wanted to explore the breadth of the NCI-niche for abundant species in Paracou, in order to see if Symphonia species case is cryptic or general, (see Schmitt et al. 2020 for TWI). We transformed the NCI individual computation in matrix product to gain computing time:
\[\begin{equation} nci_i = \sum _{j~|~d_{i,j}<20m} ^{J_i} dbh_j^2 e^{-\frac14.d_{i,j}} \tag{25.1} \end{equation}\]
\[\begin{equation} NCI = DBH^2 e^{-\frac14.D} \tag{25.2} \end{equation}\]
We used individual with DBH between 10 and 20cm at more than 20 meters from a plot limit, and species with at least 50 individuals in 2017 (Fig. 25.1). We found Symphonia species to have a NCI-niche breadth around mean niche breadth observed in Paracou (Fig. 25.2), with low values of the 5th quantile (Fig. 25.3).
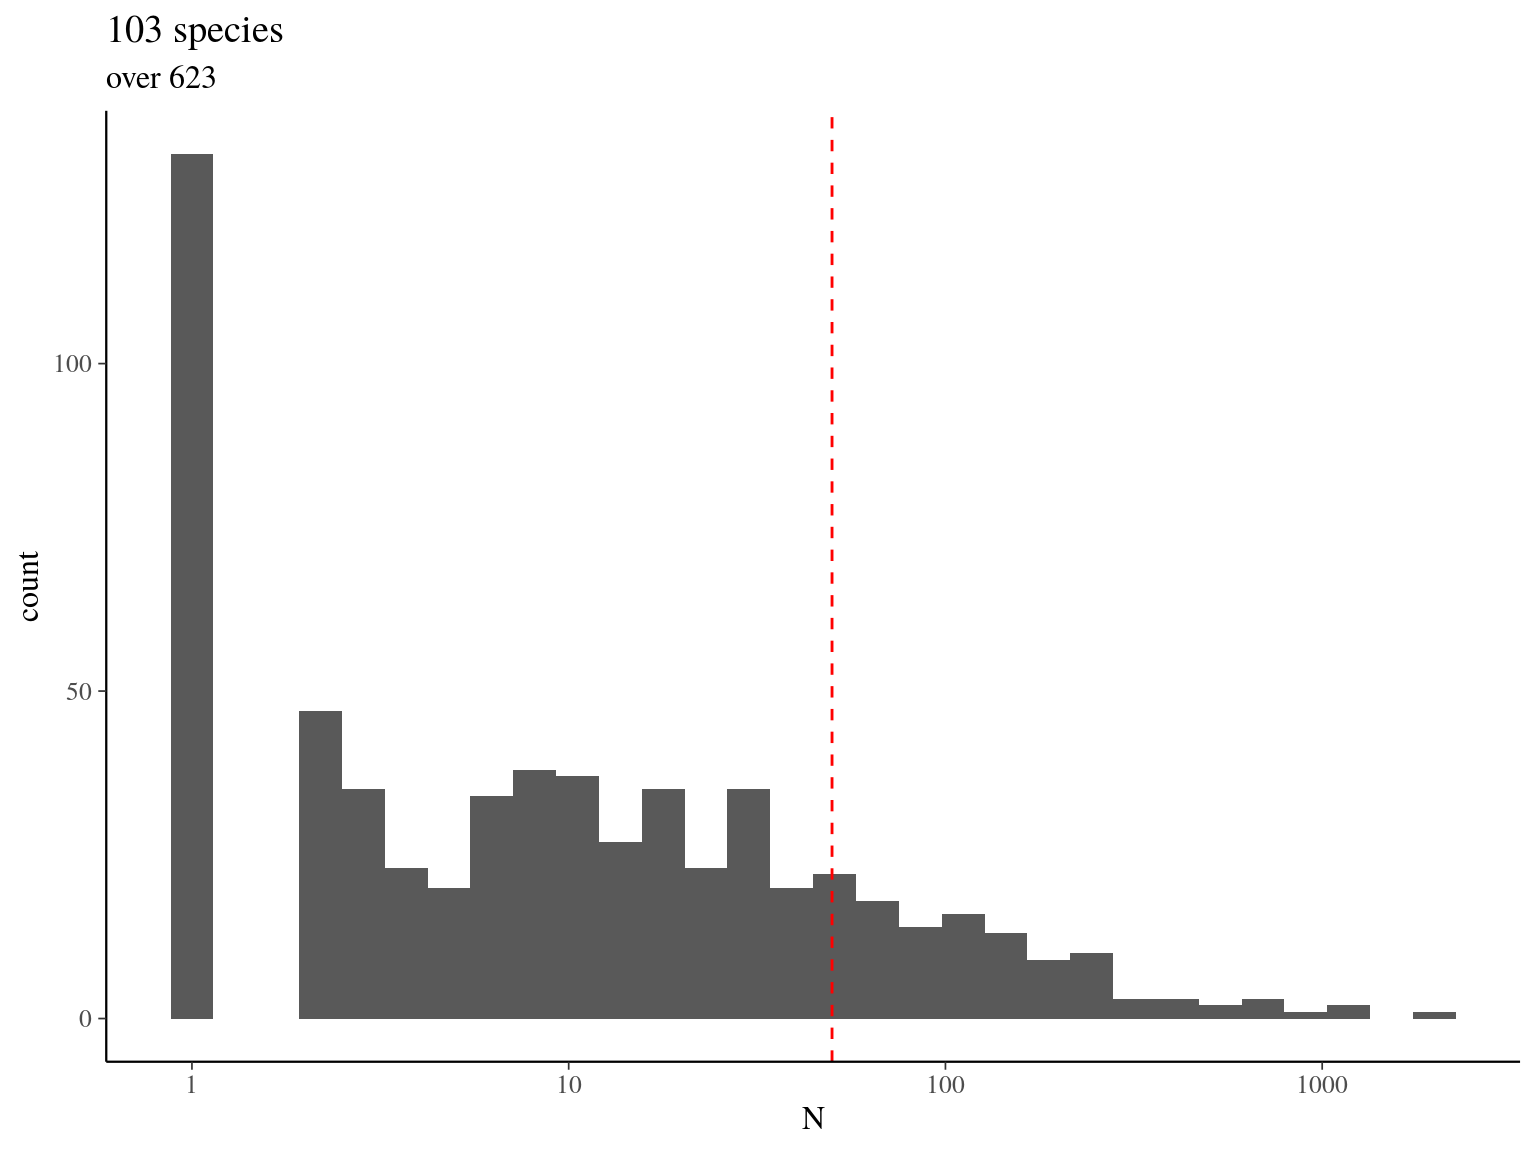
Figure 25.1: Speices abundances in plots 1 to 15 for DBH 10-20cm.
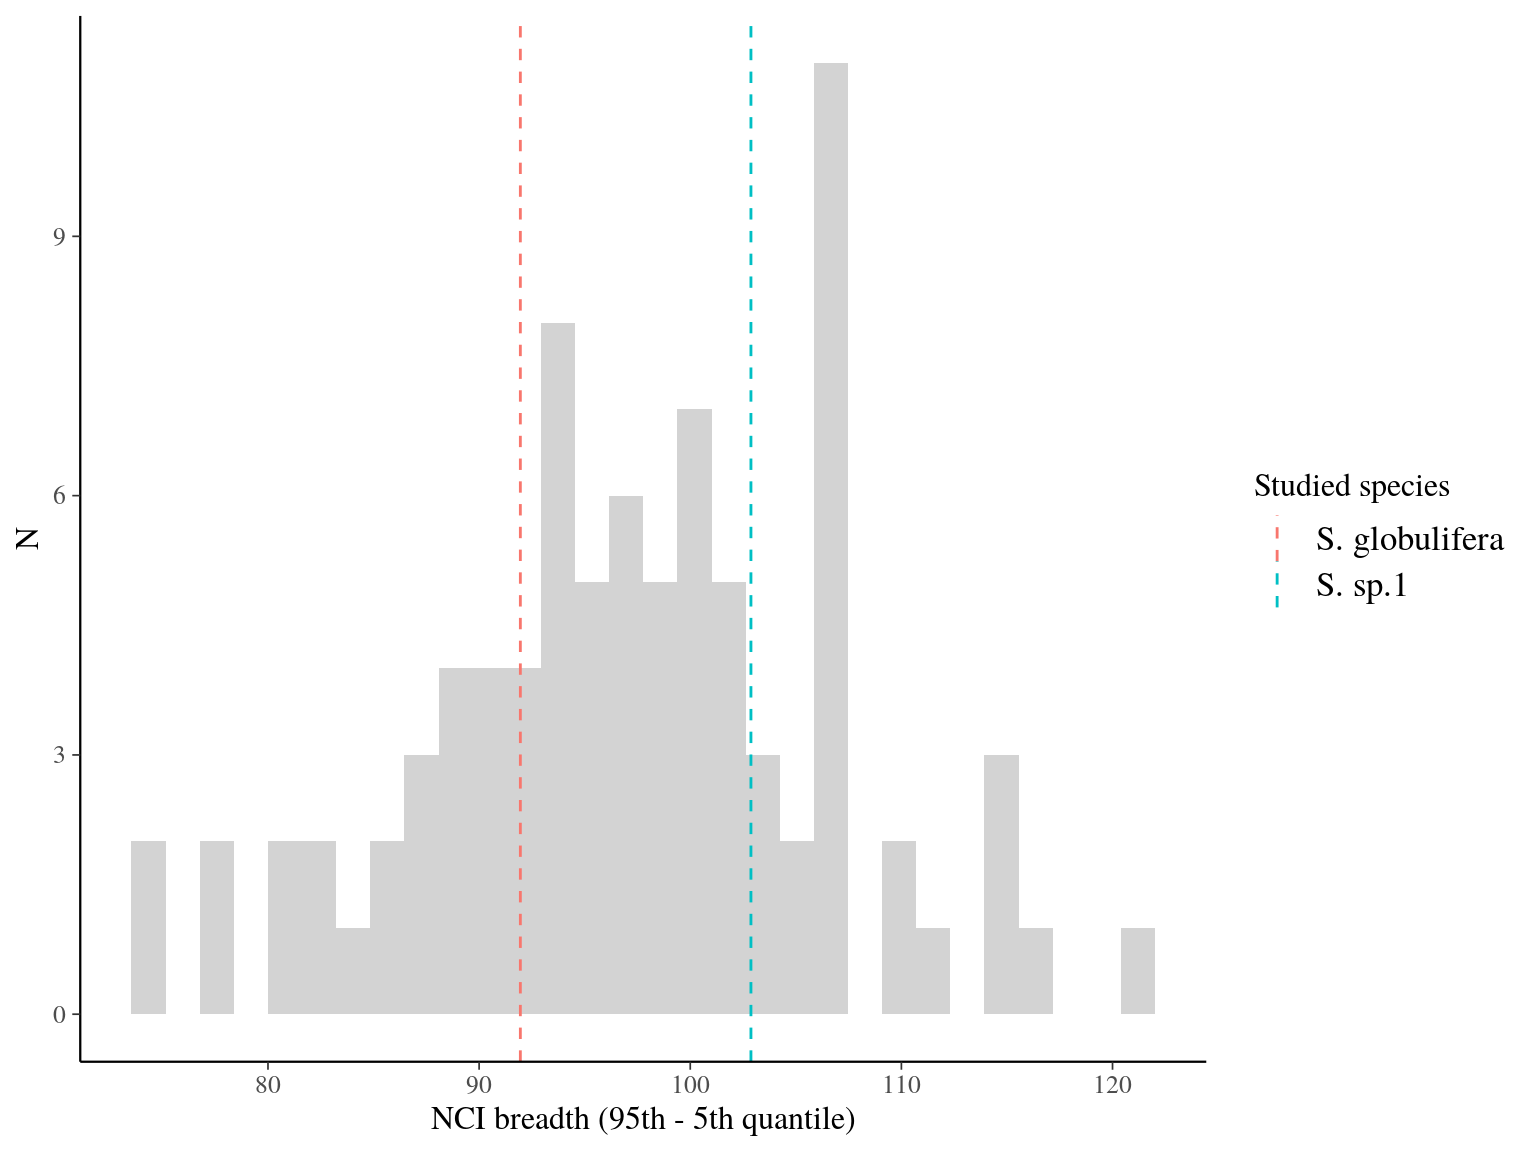
Figure 25.2: NCI breadth per species in plots 1 to 15 for 10-20 cm DBH.
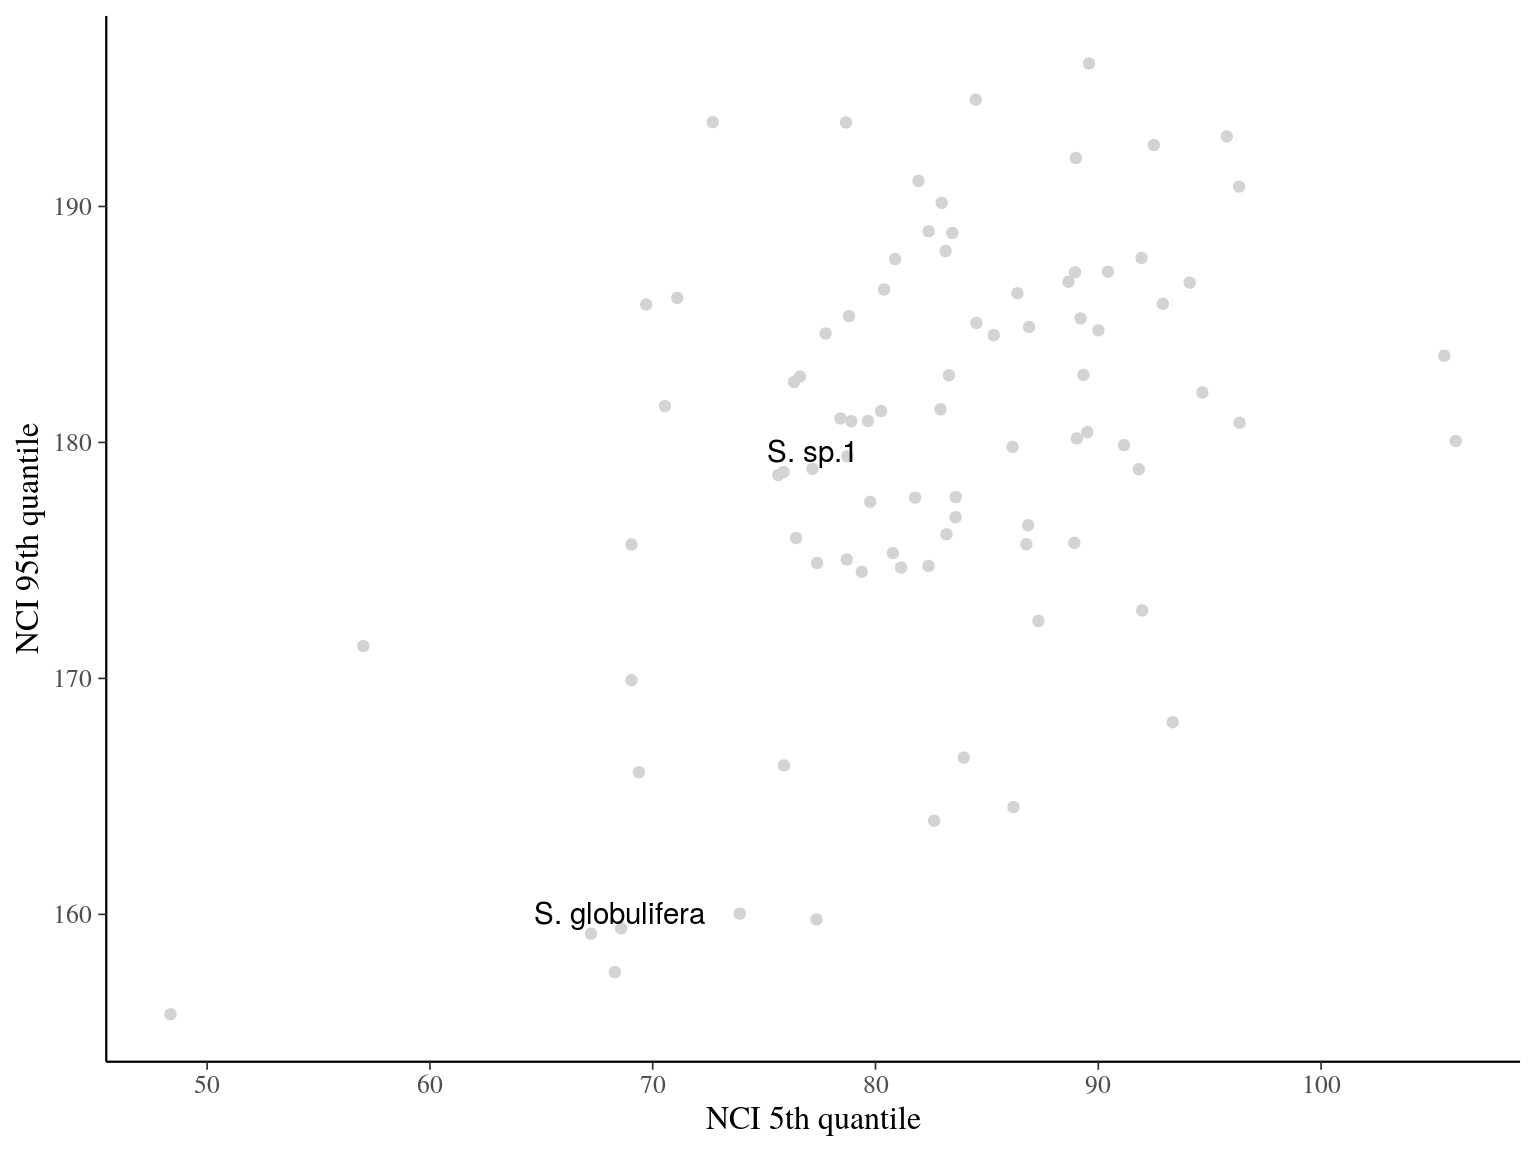
Figure 25.3: NCI breadth per species in plots 1 to 15 for 10-20 cm DBH.
25.2 BA before treefalls
Moreover, we wanted to explore the forest state before tree falls. We computed the local basal area in a grid of 10x10m for every control plots and census years (Fig. 25.4). We compared the variation of basal area along years with the previous year values (Fig. 25.5). We then investigated the distribution of the local basal area variation and we couldn’t see a clear demarcation of negatives values representing major treefalls (Fig. 25.6). We thus decided to keep all negative values to investigate the ditribution of the local basal area of the year before a decrease of basal area (Fig. 25.7), which seemed to reveal two optima: an optimum corresponding to treefalls from trees in mature stand, and a second optimum with varying values of local basal area, maybe due to kiche-hiking species favoring treefalls ?
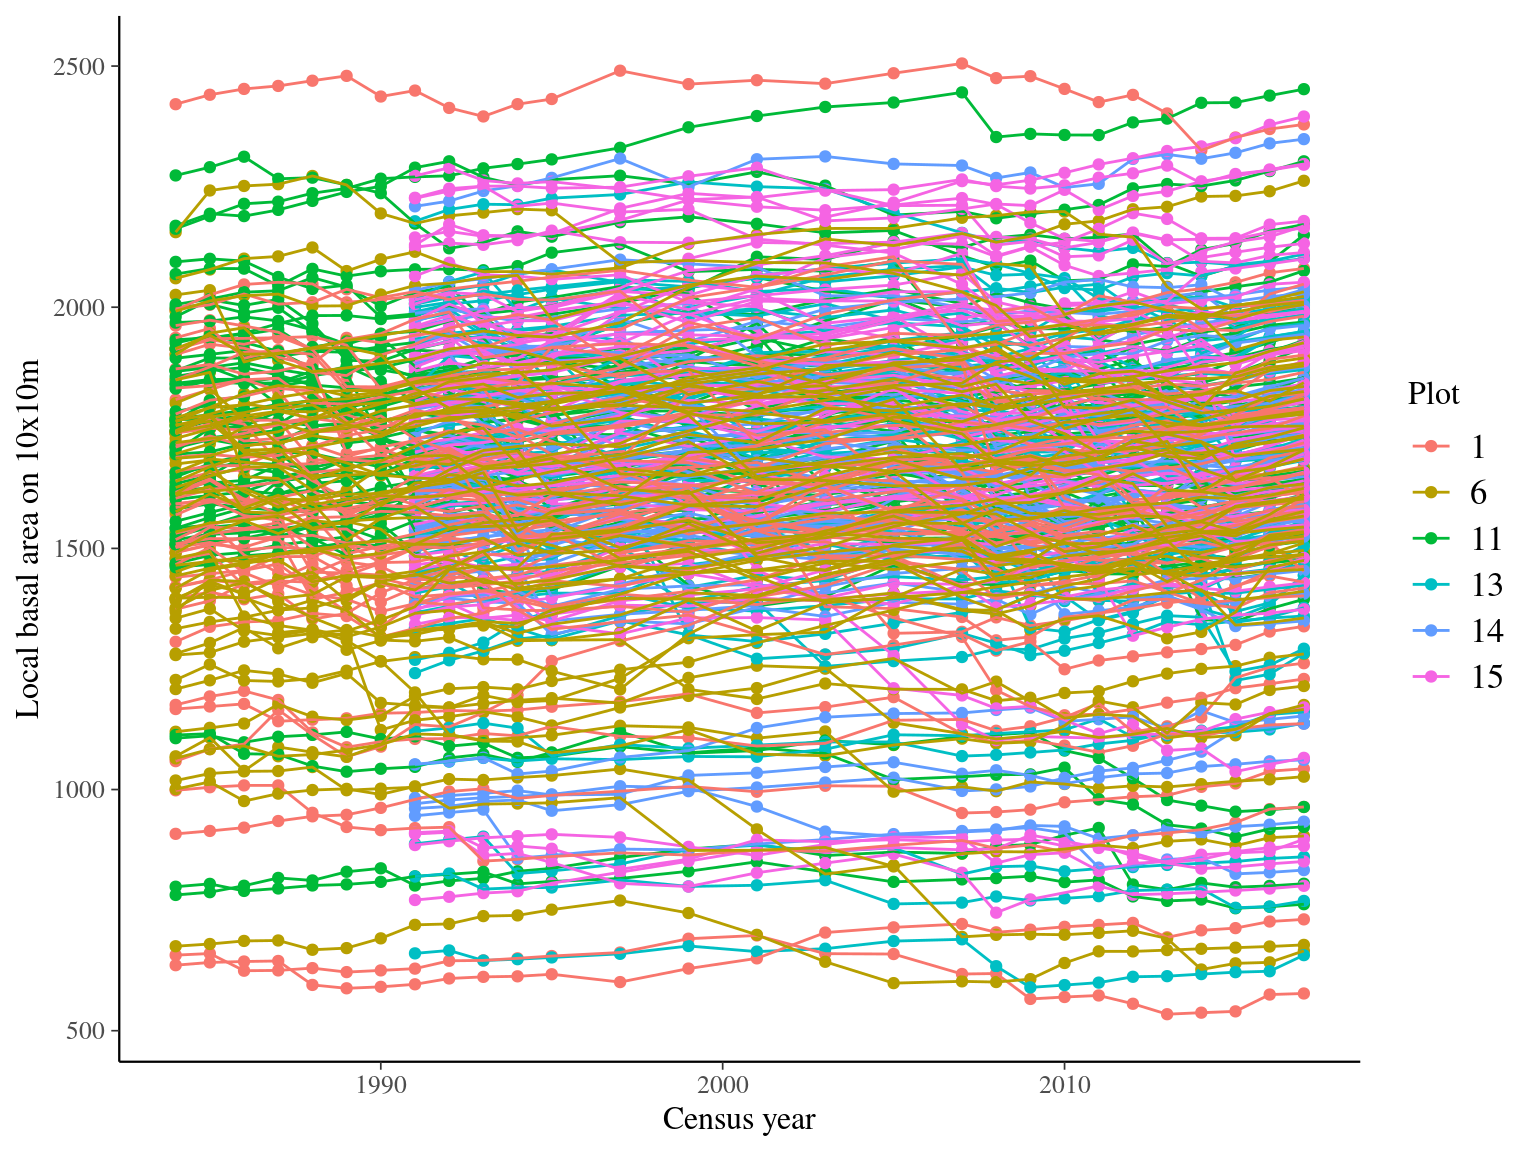
Figure 25.4: Local basal areas over census years.
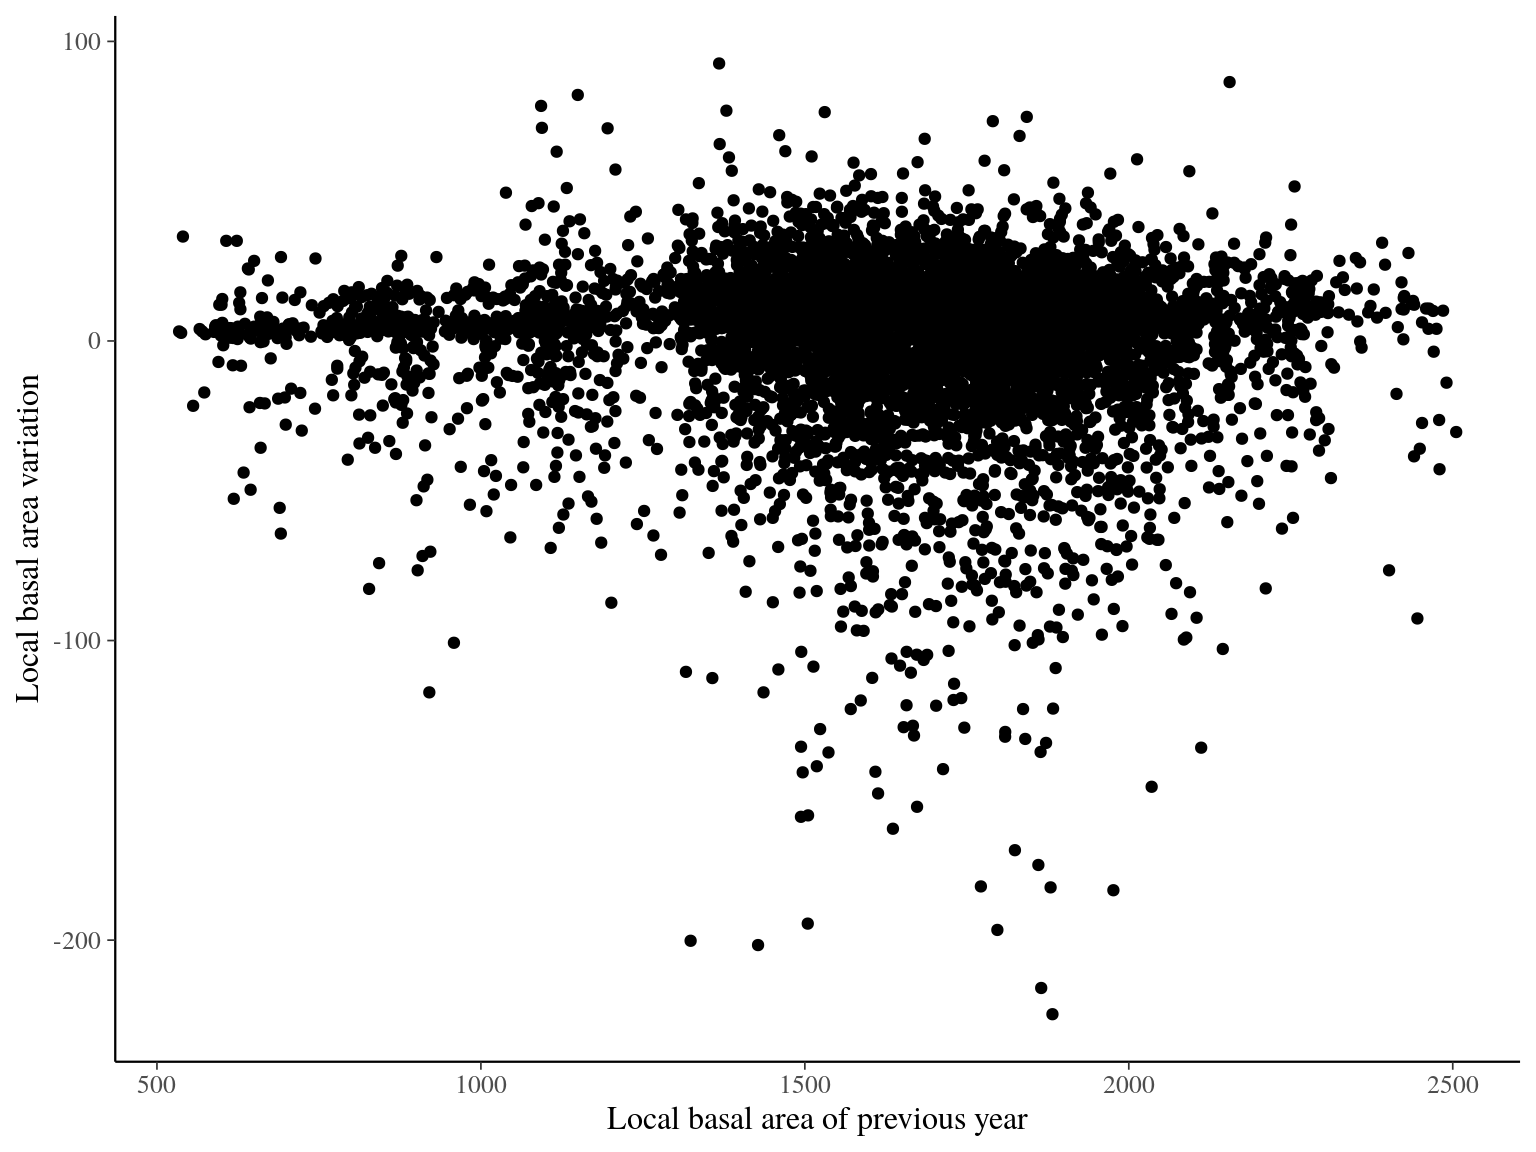
Figure 25.5: Local basal area variation depending on previous year value.
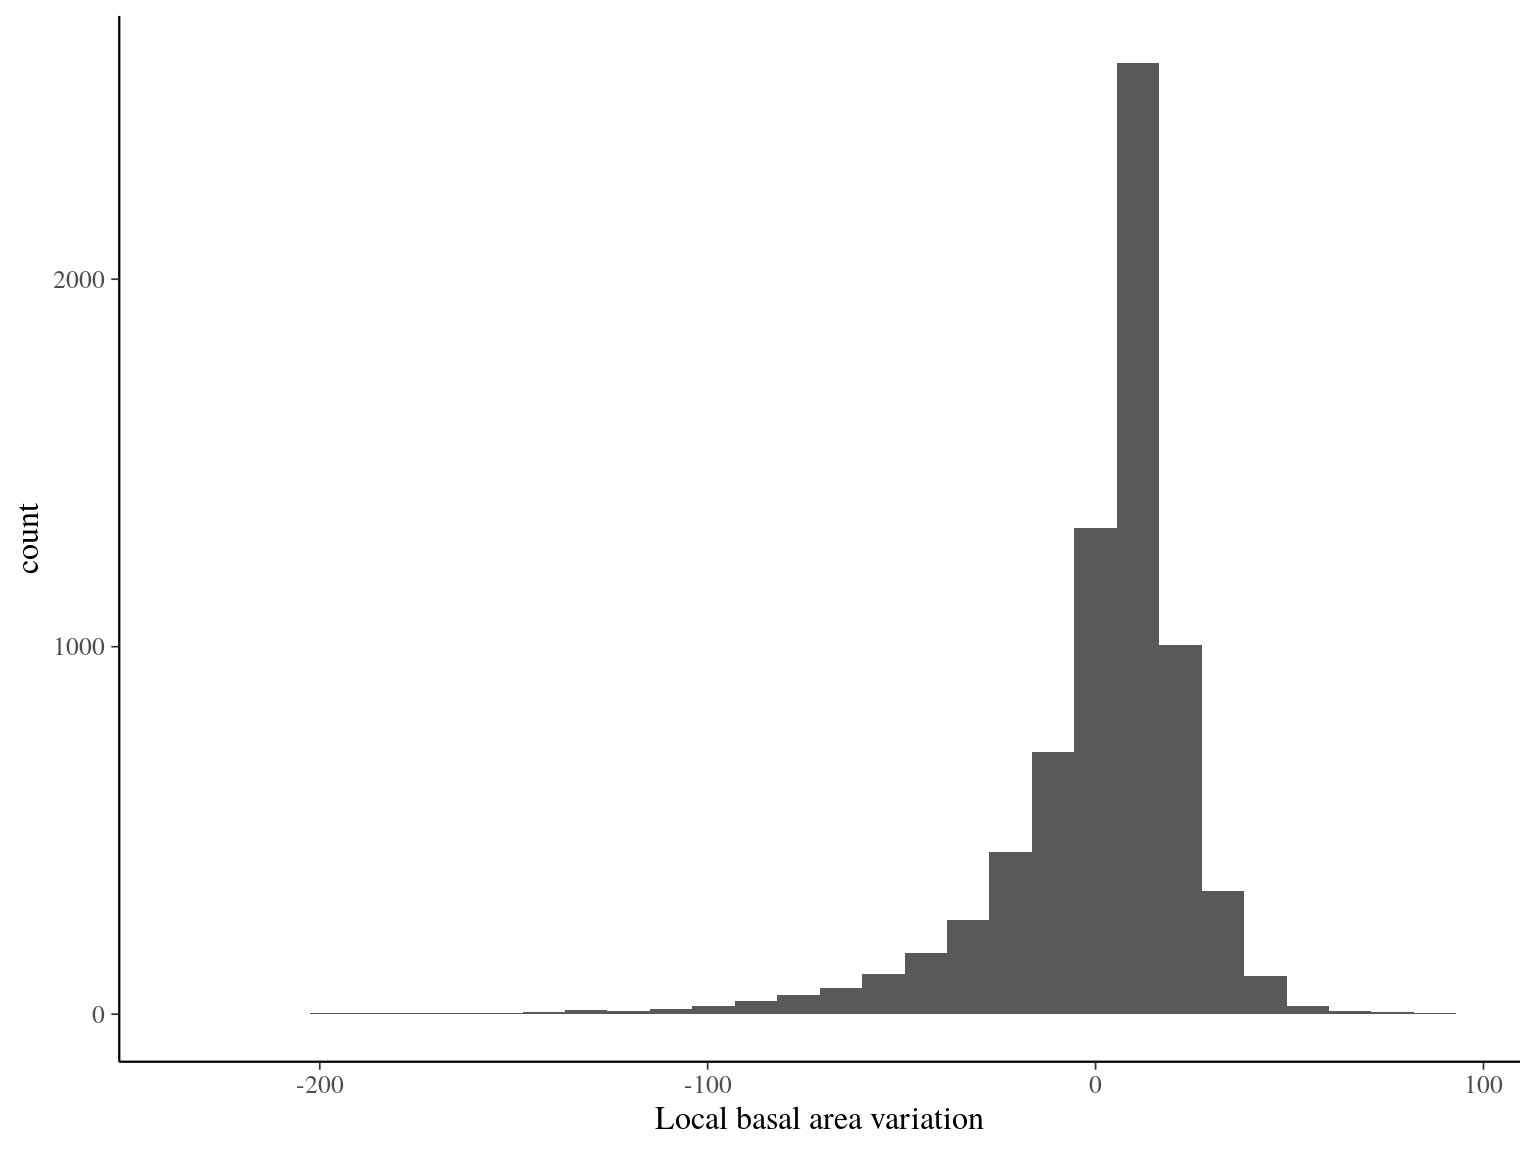
Figure 25.6: Distribution of the local basal area variation.
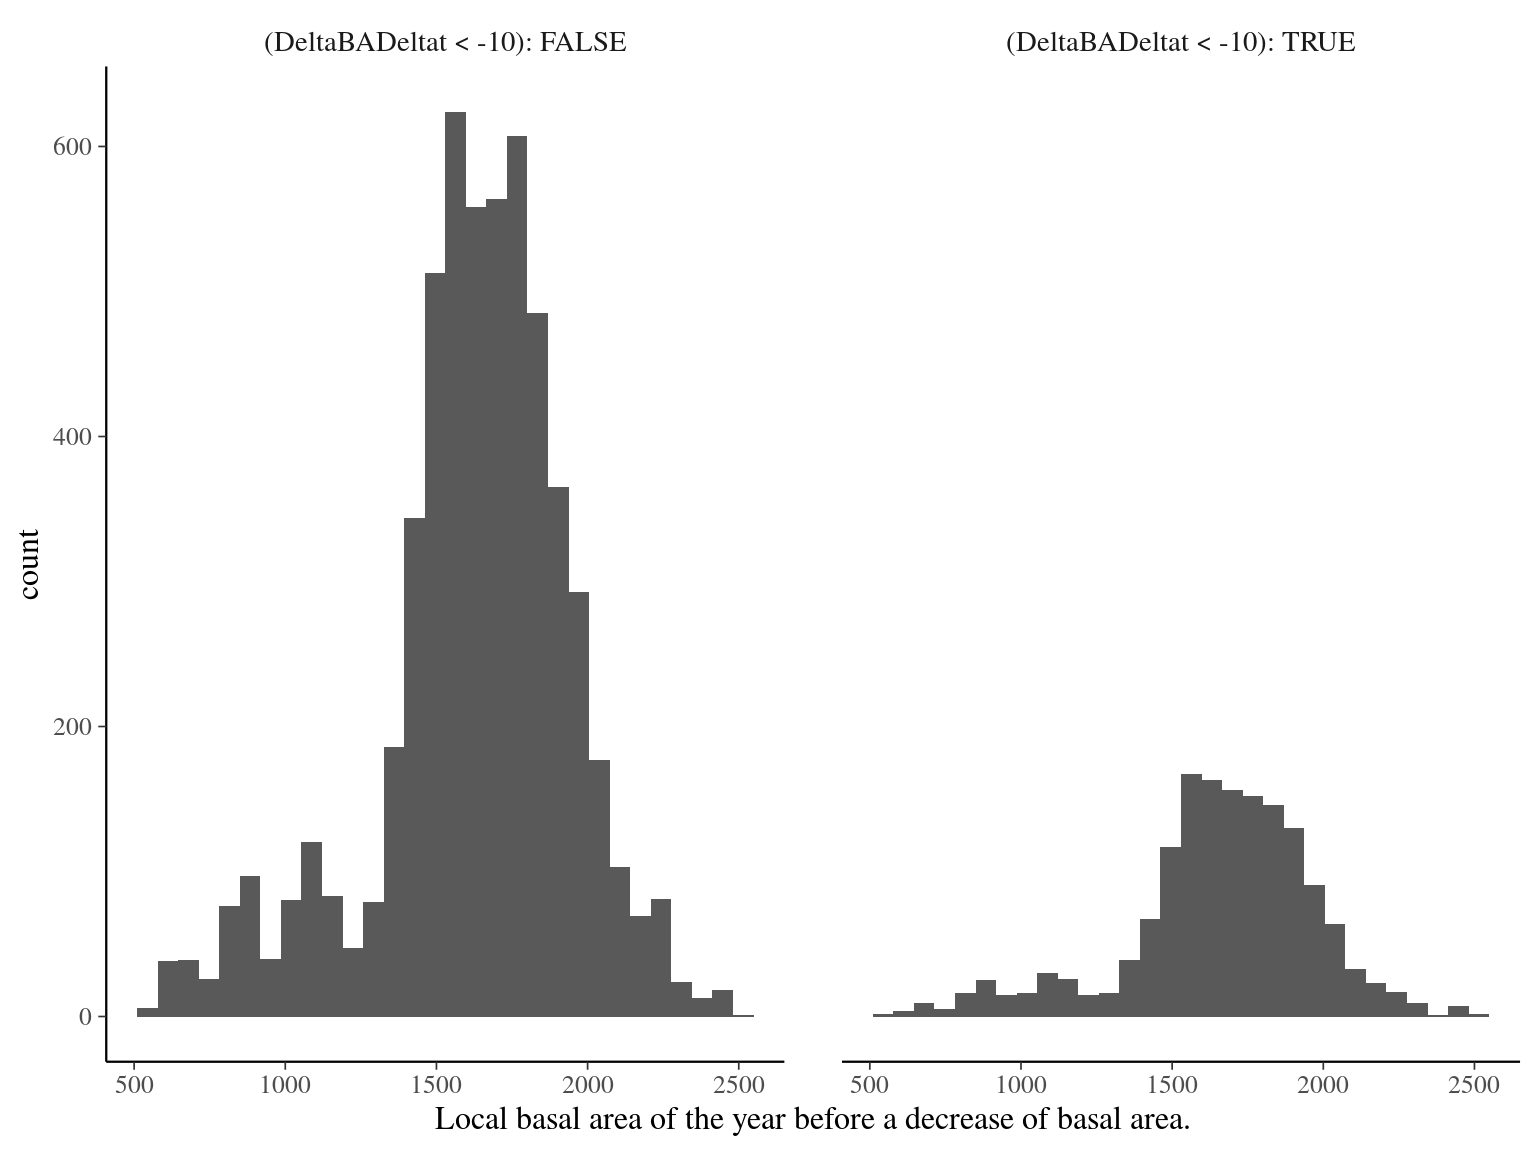
Figure 25.7: Ditribution of the local basal area of the year before a decrease of basal area
References
Schmitt, S., Hérault, B., Ducouret, É., Baranger, A., Tysklind, N., Heuertz, M., Marcon, É., Cazal, S.O. & Derroire, G. (2020). Topography consistently drives intra- and inter-specific leaf trait variation within tree species complexes in a Neotropical forest. Oikos, oik.07488. Retrieved from https://onlinelibrary.wiley.com/doi/abs/10.1111/oik.07488