Chapter 18 Population genomics
We filtered variants for genomics scans based on linkage desequilibrium and minor allele frequency. Then, we performed a genomic scan of populations genomics to identify genepool-specific SNPs.
- Linkage desequilibrium & Minor alleles frequency variants filtering for genomics scans based on linkage desequilibirum and minor allele frequency
- Genepool-specifc SNPs genomic scan to identify genepool-specific SNPs with
bayescan
18.1 Linkage desequilibrium & Minor alleles frequency
Minor alleles could bias the number of fixed loci increasing false-positives upward in genomic scans (Foll & Gaggiotti 2008), similarly linkage desequilibrium will increase the number of significant associations thus increasing false-negative when applying false discovery rate. Consequently we eplored linkage desequilibrium distribution and decay and minor allele frequency distribution (Fig. 18.1). We chose to filter variants with a minor allele frequency above 5% (at least 18 individuals have the minor allele in the population) and with linkage desequilibirum \(r^2<0.99\). It reduced the dataset to 70 737 SNPs.
module load bioinfo/plink-v1.90b5.3
plink \
  --bfile symcapture.all.biallelic.snp.filtered.nonmissing.paracou3pop \
  --allow-extra-chr \
  --r2 with-freqs \
  --ld-window 33137 \
  --indep-pairwise 1000 500 0.99 \
  --out LD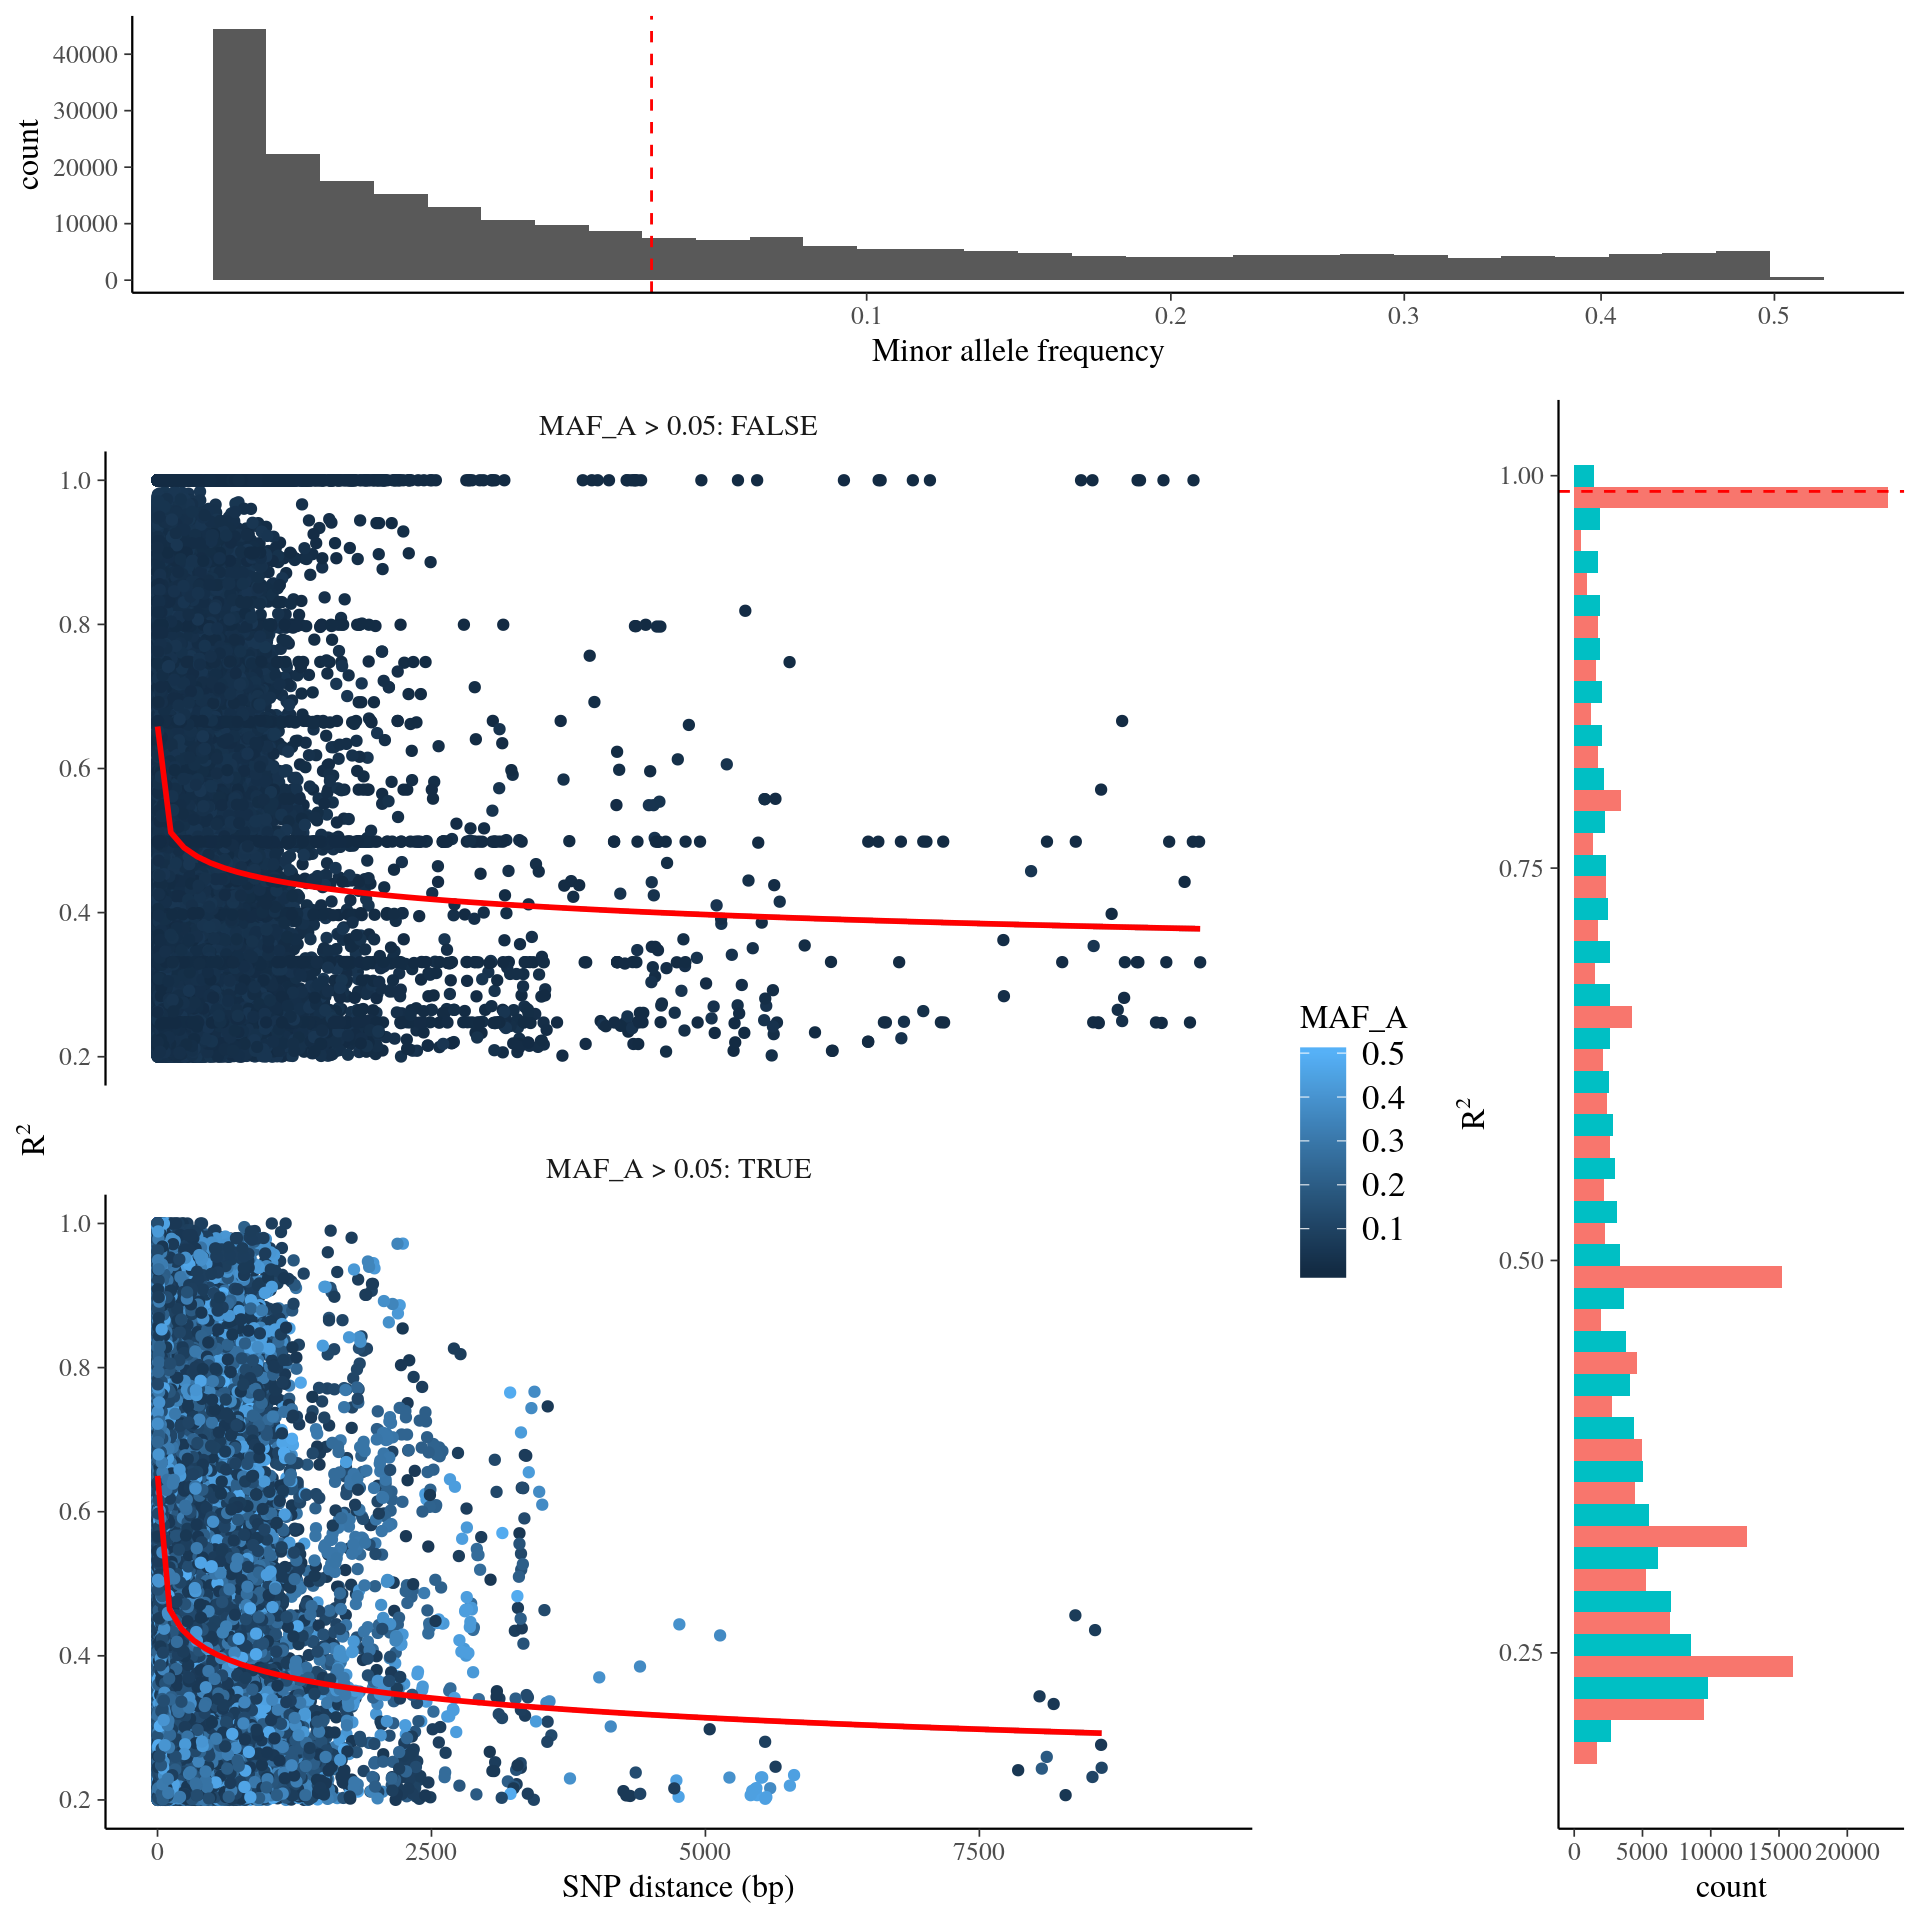
Figure 18.1: Linkage desequilibirum and minor allele frequency distribution in SNPs.
18.2 Genepool-specifc SNPs
We used bayescan on filtered SNPs, to detect outlier of genepools-specifc SNP with a q-value < 0.05 (Fig. 18.3). We found 4 020 SNPs significantly associated to genepools or fixed SNPs representing 5.7% of all SNPs with 309 functional SNPs, 2456 hitchhikers, and 1255 neutral. Hitchhikers corresponded to 43 106 transcripts isoforms and functional to 2 981 with 2 587 in common. Among the assocaited transcripts isoforms, 89 were differentialy expressed in S. globulifera and 32 in S. sp1 in juveniles (Tysklind et la., in prep). Corresponding genes matched 1133 unique terms of gene ontology (GO) with no significantly enriched GO term in outliers genes (besides a p-value of 0.01106483 for response to water deprivation, Fig. 18.4, REVIGO can be used for results vizualisation).
module load bioinfo/plink-v1.90b5.3
module load bioinfo/PGDSpider_2.1.1.5
module load bioinfo/BayeScan2.1
plink \
  --bfile symcapture.all.biallelic.snp.filtered.nonmissing.paracou3pop \
  --allow-extra-chr \
  --extract LD.prune.in \
  --maf 0.05 \
  --make-bed \
  --recode vcf-iid \
  --out ../../populationGenomics/bayescan/paracou3pop
java -Xmx100G -Xms90G -jar $PGD_HOME/PGDSpider2-cli.jar \
    -inputfile paracou3pop.vcf \
    -inputformat VCF \
    -outputfile paracou3pop.bayescan \
    -outputformat GESTE_BAYE_SCAN \
    -spid vcf2bayescan.spid
BayeScan -threads 10 \
    paracou3pop.bayescan \
    > paracou3pop.bayescan.output
# filter(bayescan, qval < 0.05) %>%
#   dplyr::select(snp) %>%
#   write_tsv(file.path(path, "bayescan", "bayescan.snps.list"), col_names = F)
plink  \
  --bfile paracou3pop \
  --allow-extra-chr \
  --extract bayescan.snps.list \
  --recode A \
  --out bayescan.snps
plink  \
  --bfile ../../variantCalling/paracou/symcapture.all.biallelic.snp.filtered.nonmissing.paracou \
  --allow-extra-chr \
  --extract bayescan.snps.list \
  --recode A \
  --out bayescan.snps.paracou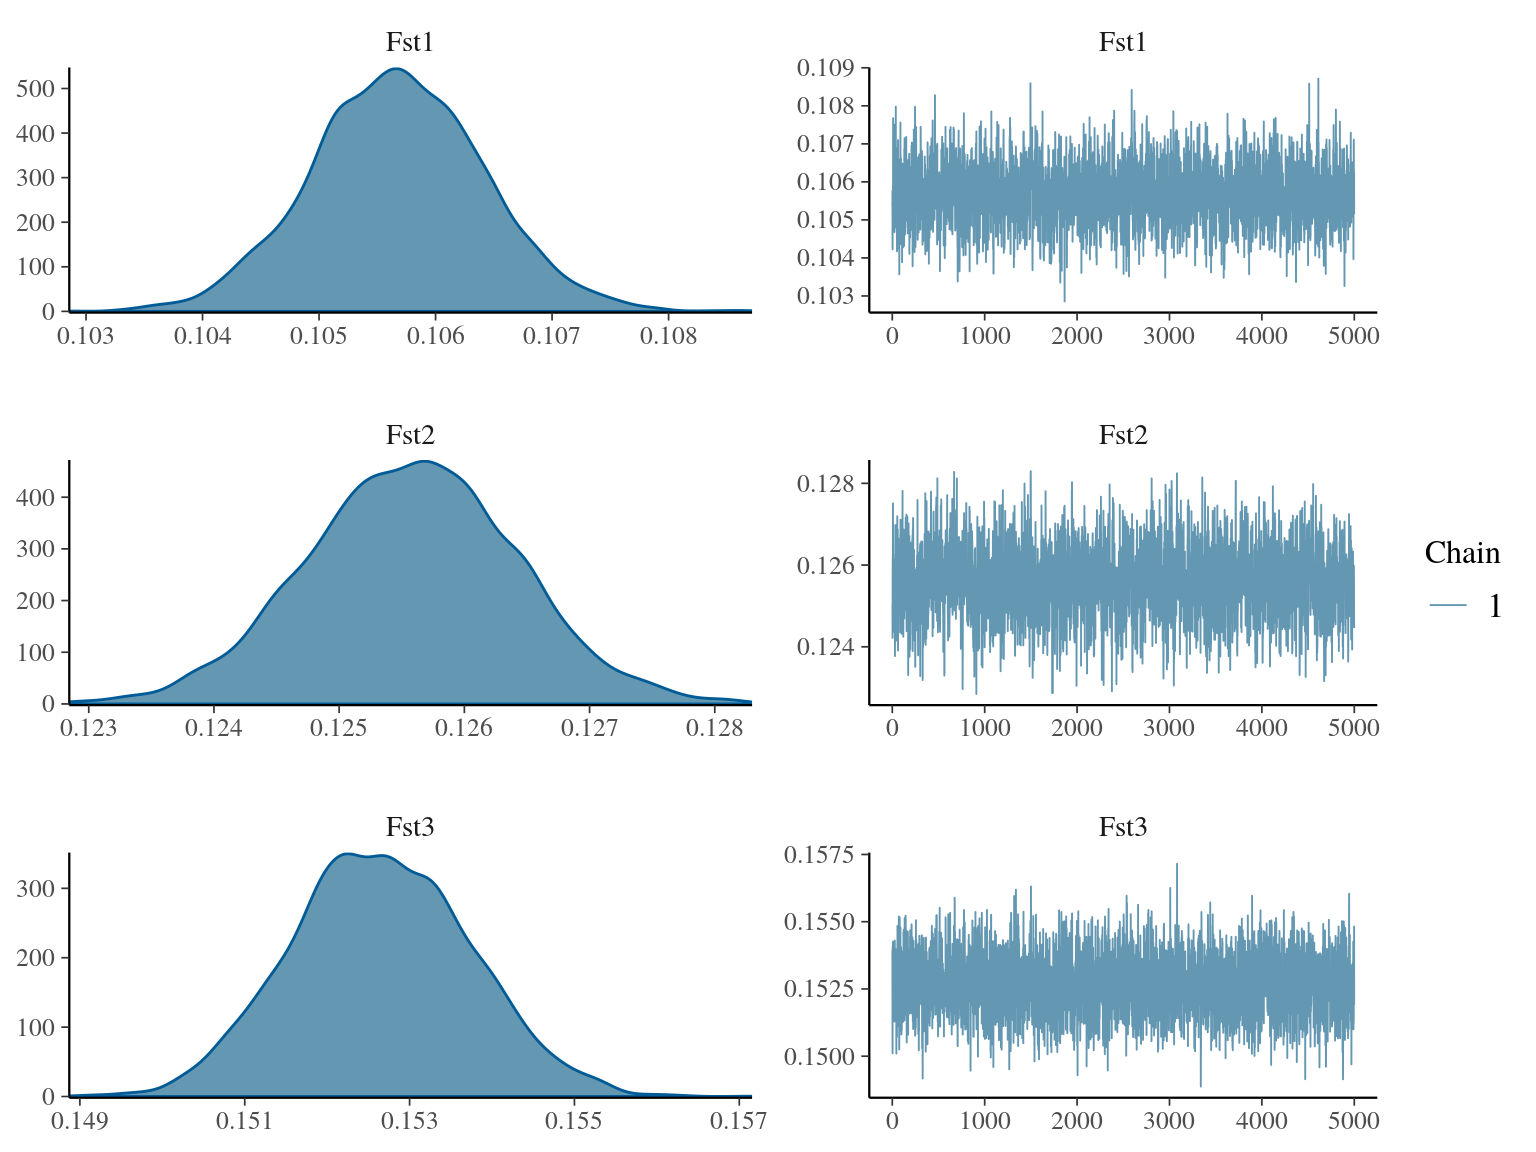
Figure 18.2: Population Fst convergence.
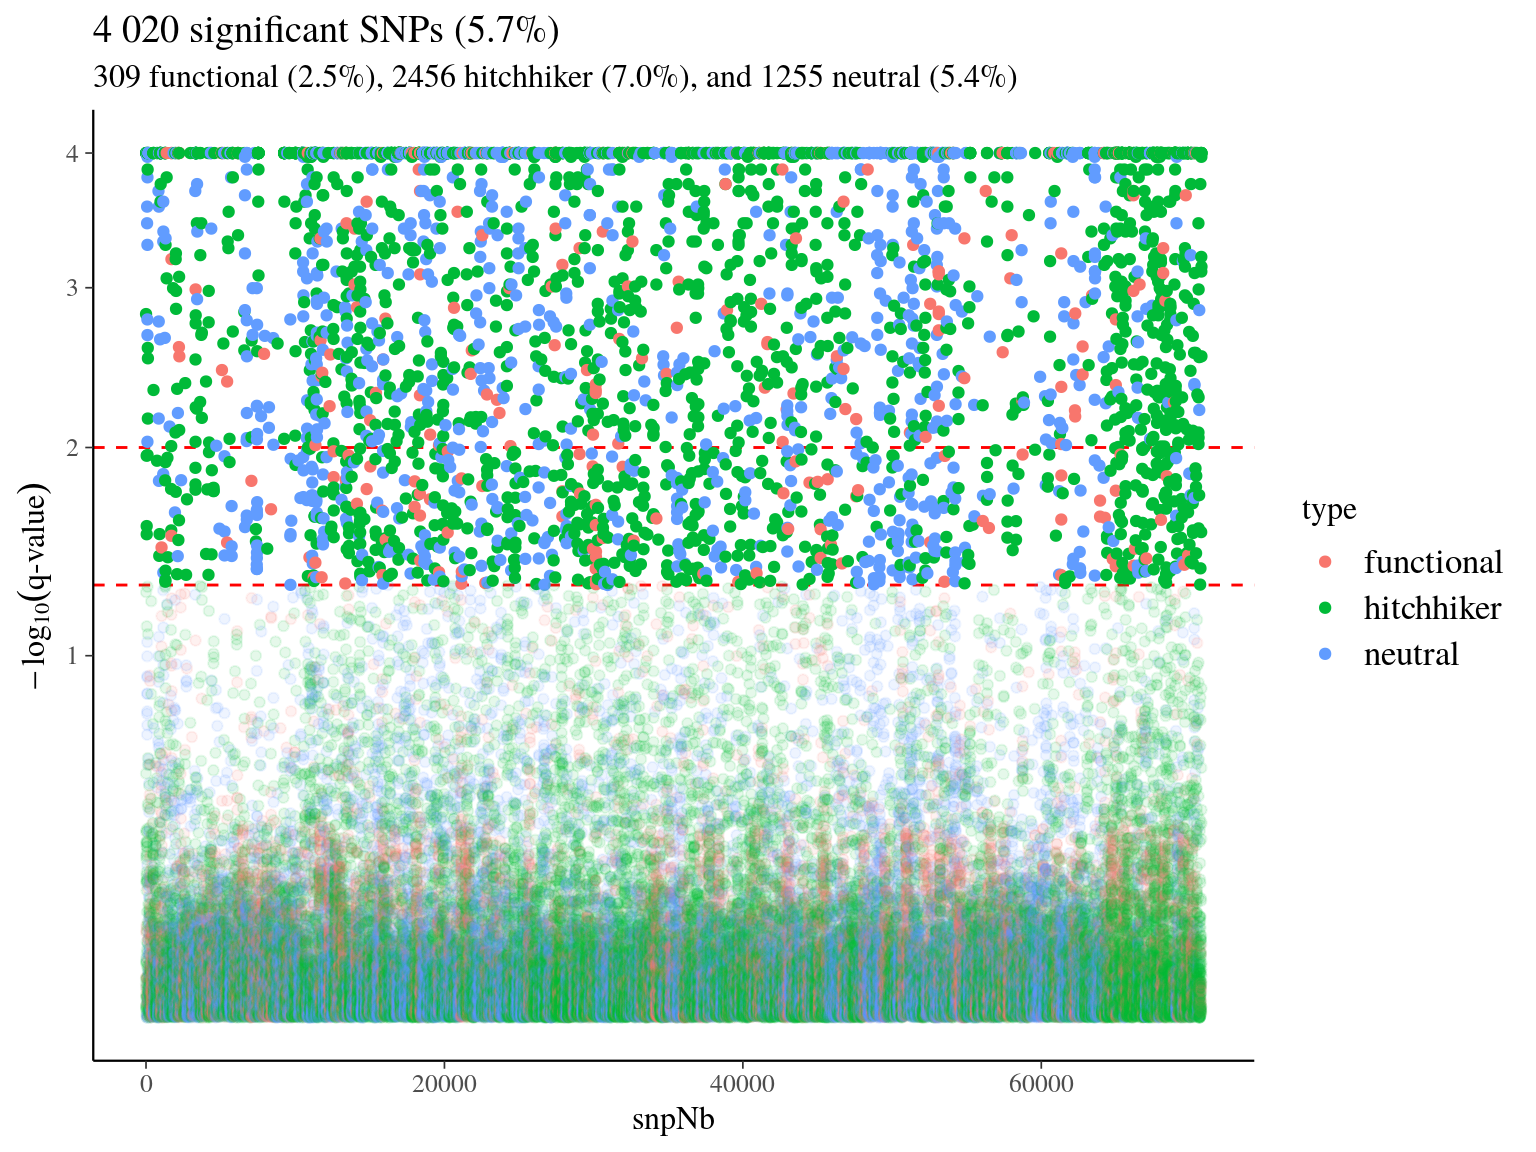
Figure 18.3: Genotype-specific SNPs.
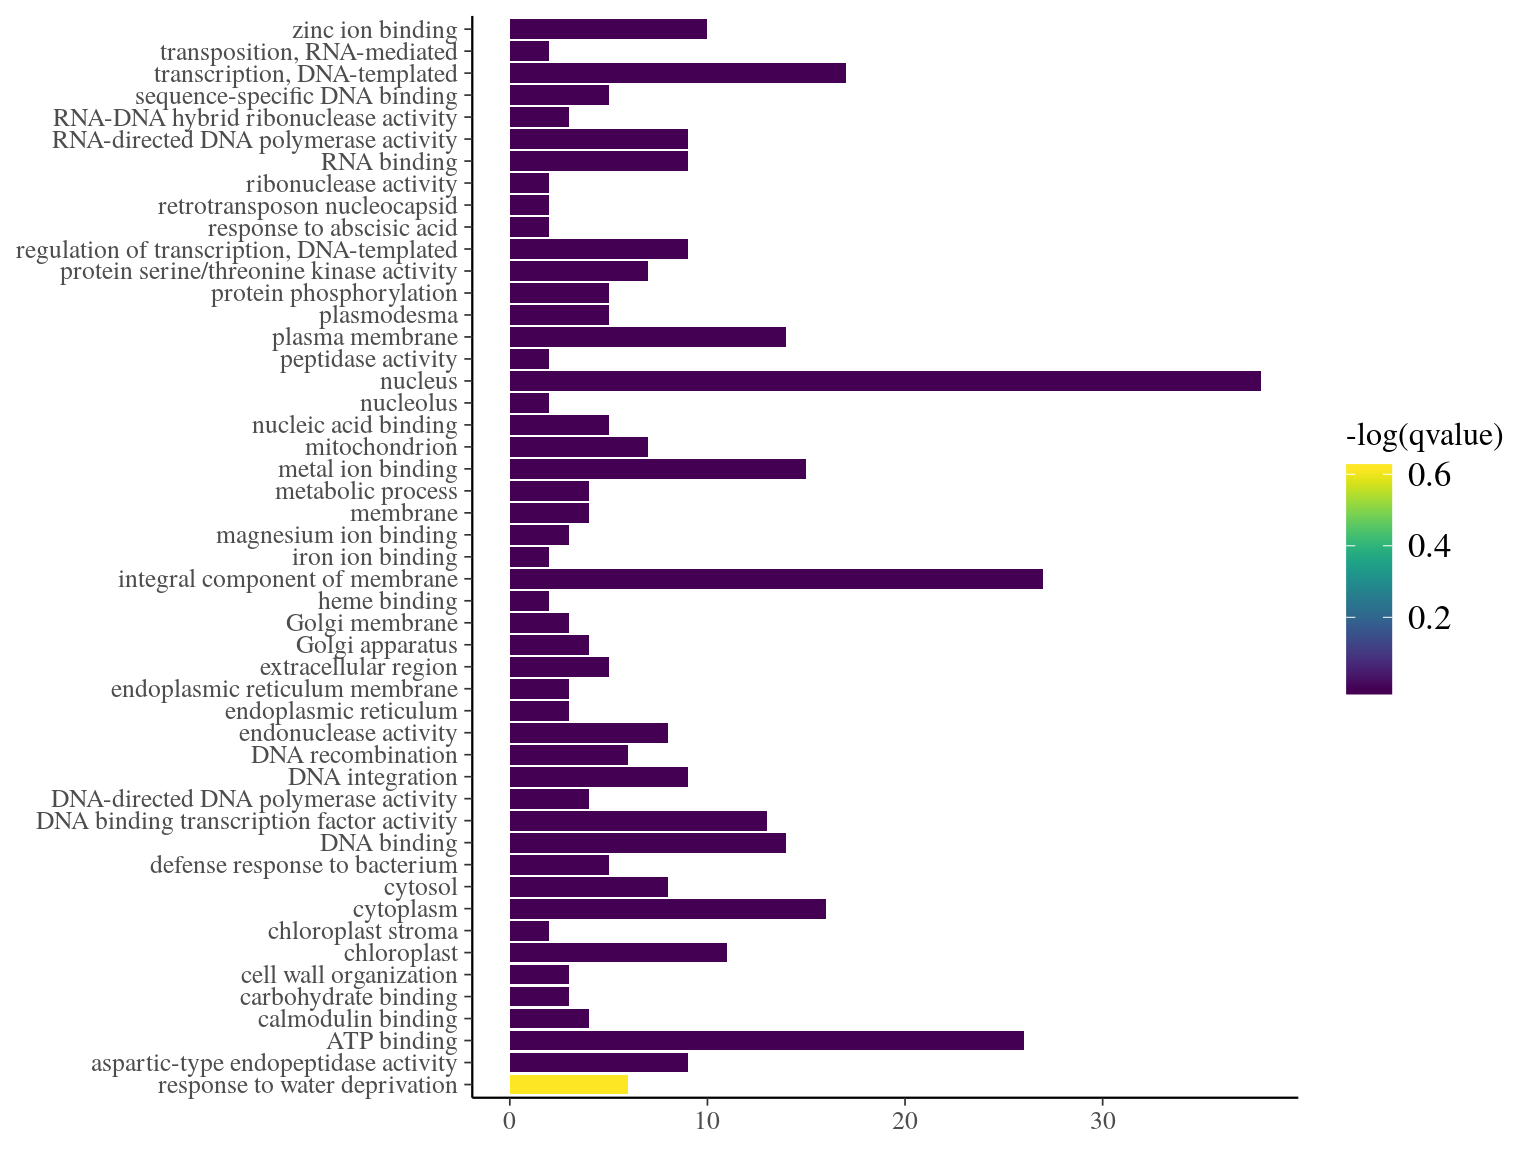
Figure 18.4: Term enrichment of Gene Ontology (GO) for outliers genes.
TRINITY_DN795961_c2_g1/TRINITY_DN796902_c0_g1/TRINITY_DN800044_c7_g3/TRINITY_DN817465_c3_g1/TRINITY_DN827983_c2_g1/TRINITY_DN828088_c2_g1
References
Foll, M. & Gaggiotti, O. (2008). A genome-scan method to identify selected loci appropriate for both dominant and codominant markers: A Bayesian perspective. Genetics, 180, 977–993. Retrieved from http://www.ncbi.nlm.nih.gov/pubmed/17246615 http://www.pubmedcentral.nih.gov/articlerender.fcgi?artid=PMC1201091 http://www.ncbi.nlm.nih.gov/pubmed/18780740 http://www.pubmedcentral.nih.gov/articlerender.fcgi?artid=PMC2567396