Chapter 23 Introgressions
Genomics structure analyses (population, envionmental and growth genomics) have been done with pure populations, defined with admixture as individuals with more than 90% of its genotype related to the genepool, rejecting admixed and introgressed individuals. In order to explore the importance of gene flow in the Symphonia species complex, we then explored admixed and introgressed individuals by identifying theim (introgress), scanning loci genomci clines (bgc), and exploring their distribution along environmental variables (\(TWI\) and \(NCI\)) and individual growth potential (\(Gmax\)).
23.1 Methodology
Another demographic process that can lead to idiosyncratic effects at individual loci is hybridization and introgression from related taxa (Hoban et al. 2016)
This justify the realization of all genomics scan without admixed individuals and the inclusion of admixed individuals a posteriori.
23.2 Identification
We used the method developed by Gompert & Buerkle (2009) implemented in introgress (Gompert & Alex Buerkle 2010) to map admixture between Paracou genepools. We used individuals with more than 90% of the genotype belonging to the genepool to define parental allele frequencies and mapped admixture between the two pairs of S. sp1 - S. globulifera Paracou and S. sp1 - S. globulifera Regina as the remaining pair didn’t show admixture sign with the admixture software. We furthered classified individuals as (i) pure-bred with a hybrid index \(h\) above 0.9, (ii) introgressed with \(h \in [0.6-0.9]\), and (iii) admixed with \(h \in [0.5-0.6]\).
We obtained relatilevely low levels of admixture (Fig. 23.1) with 222 S. sp1 pure-bred, 108 S. globulifera Paracou pure-bred, and 30 S. globulifera Regina pure-bred. Only 5 individuals were admixed (2 S. sp1 - S. globulifera Regina and 3 S. sp1 - S. globulifera Paracou). Nevertheless S. sp1 showed 13(6%) individuals introgressed with S. globulifera Regina and S. globulifera Paracou showed 7(6%) individuals introgressed with S. sp1.
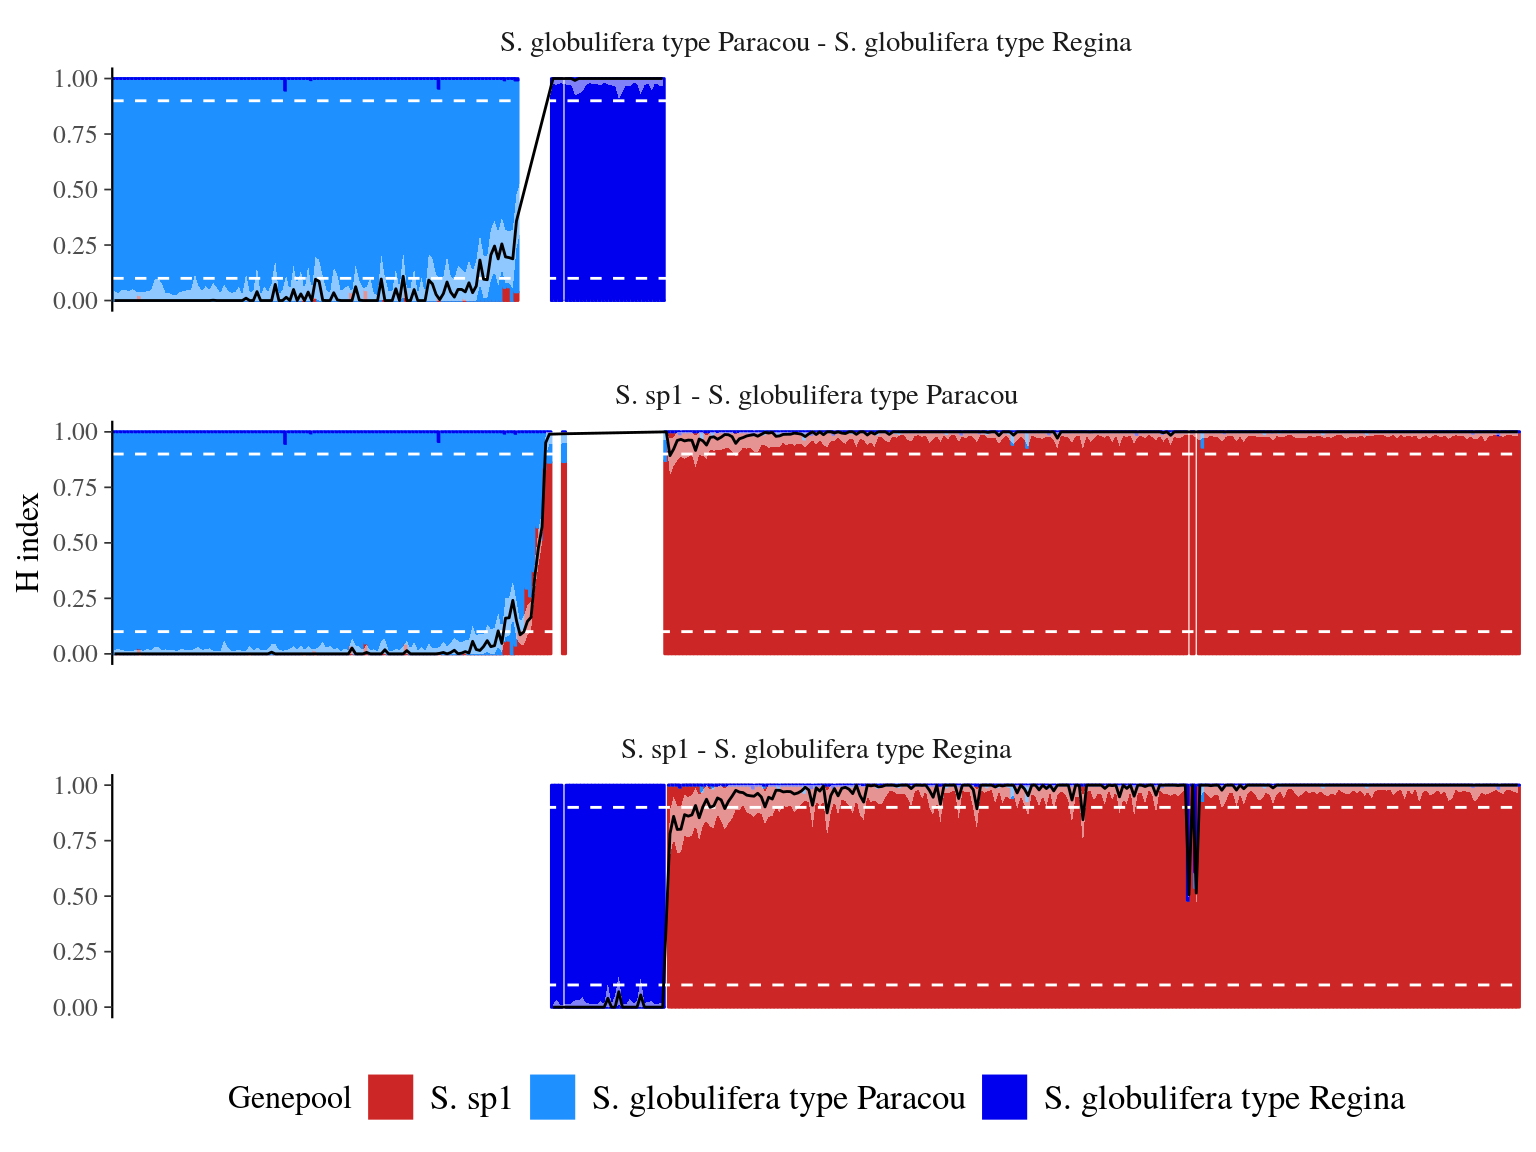
Figure 23.1: Population structure and fraction of the genome inherited from S. sp1 for each individual (hybrid index or admixture coefficient). Population structure assessed with ADMIXTURE is represented with the color bar for each individual, with the percentage of membership to S. sp1 genepools represented by the bar height. The hybdrid index and it’s confidence interval is represented by the black line and the white area. The white dashed line indicates levels used to define previous genepools and parental alleles frequencies.
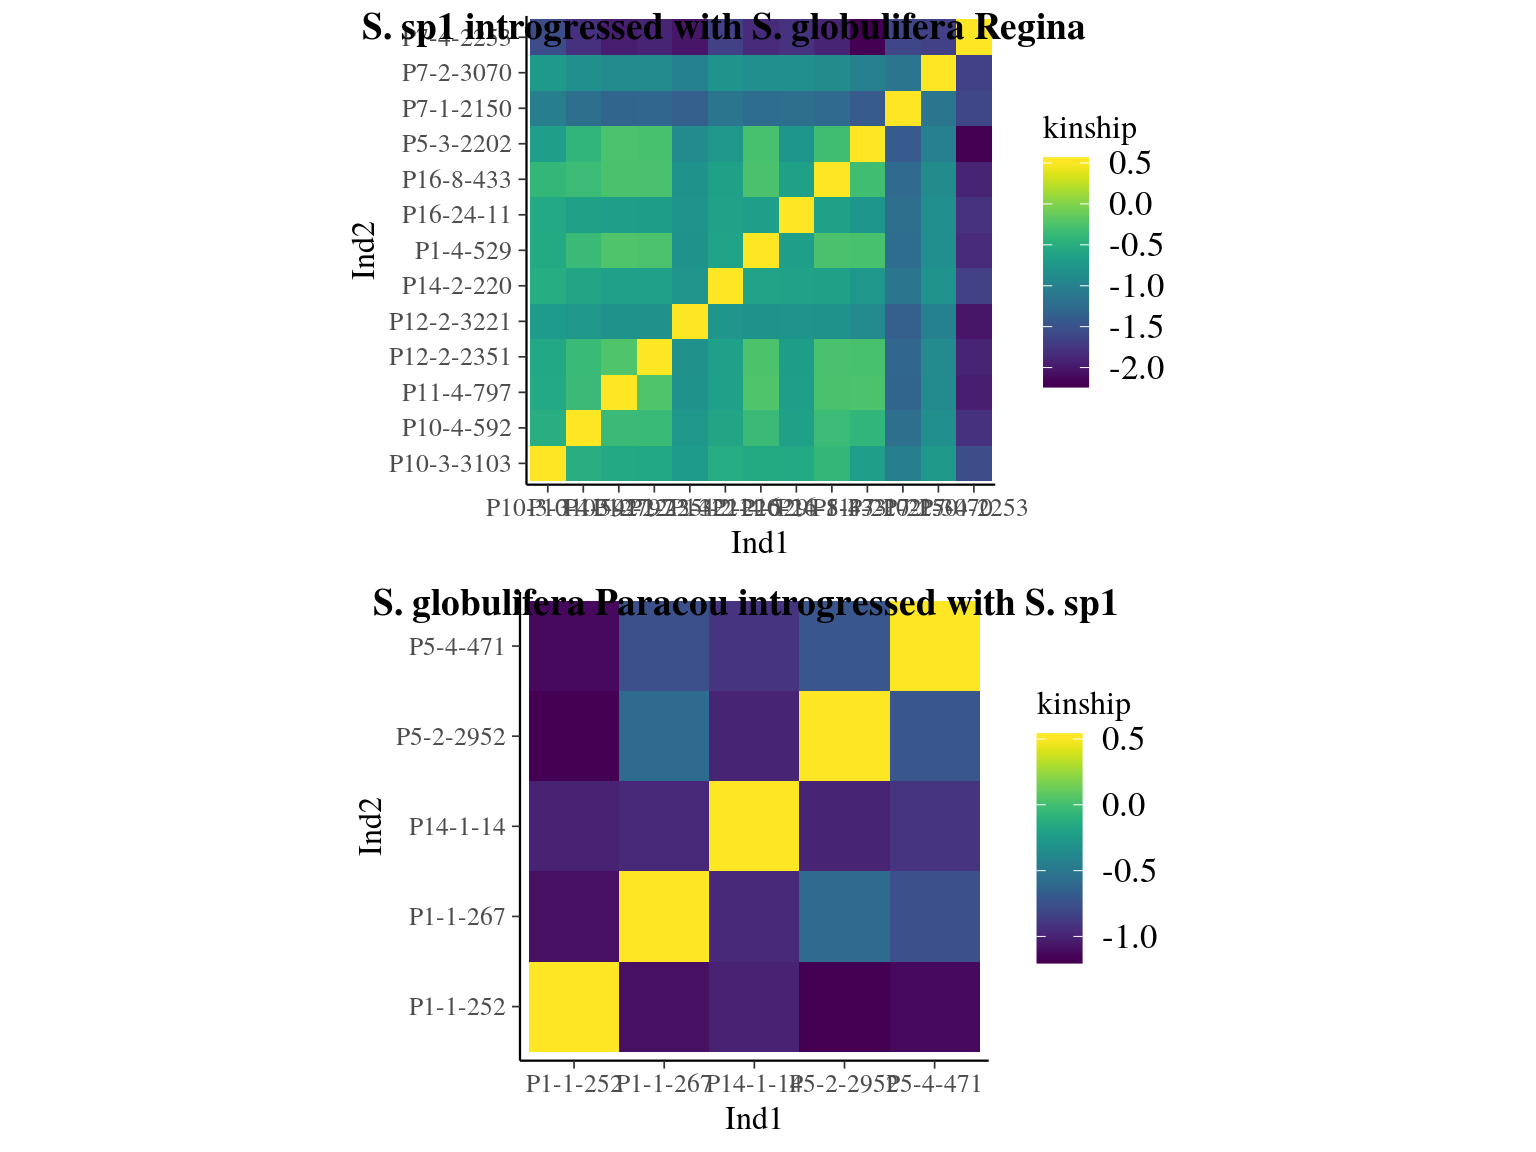
Figure 23.2: Kinship relationships between introgressed individuals.
23.3 Loci
(Racimo et al. 2016; Burgarella et al. 2019; Pfeifer et al. 2019; Pfeifer & Kapan 2019)
Use bgc
plink=~/Tools/plink_high_contig/plink
$plink \
  --bfile ../paracou/symcapture.all.biallelic.snp.filtered.nonmissing.paracou \
  --allow-extra-chr \
  --set-missing-var-ids @_snp# \
  --mind 0.9 \
  --geno 0 \
  --recode A-transpose \
  --make-bed \
  --out bgc
No linkage map as contigs are too shot !
bgc=~/Tools/bgcdist/bgc
$bgc \
  -a S.sp1pure.txt \
  -b S.globuliferaParacoupure.txt \
  -h admixed.sp.txt \
  -F admixed.sp \
  -p 2 \
  -q 1
$bgc \
  -a S.sp1pure.txt \
  -b S.globuliferaReginapure.txt \
  -h admixed.sr.txt \
  -F admixed.sr \
  -p 2 \
  -q 1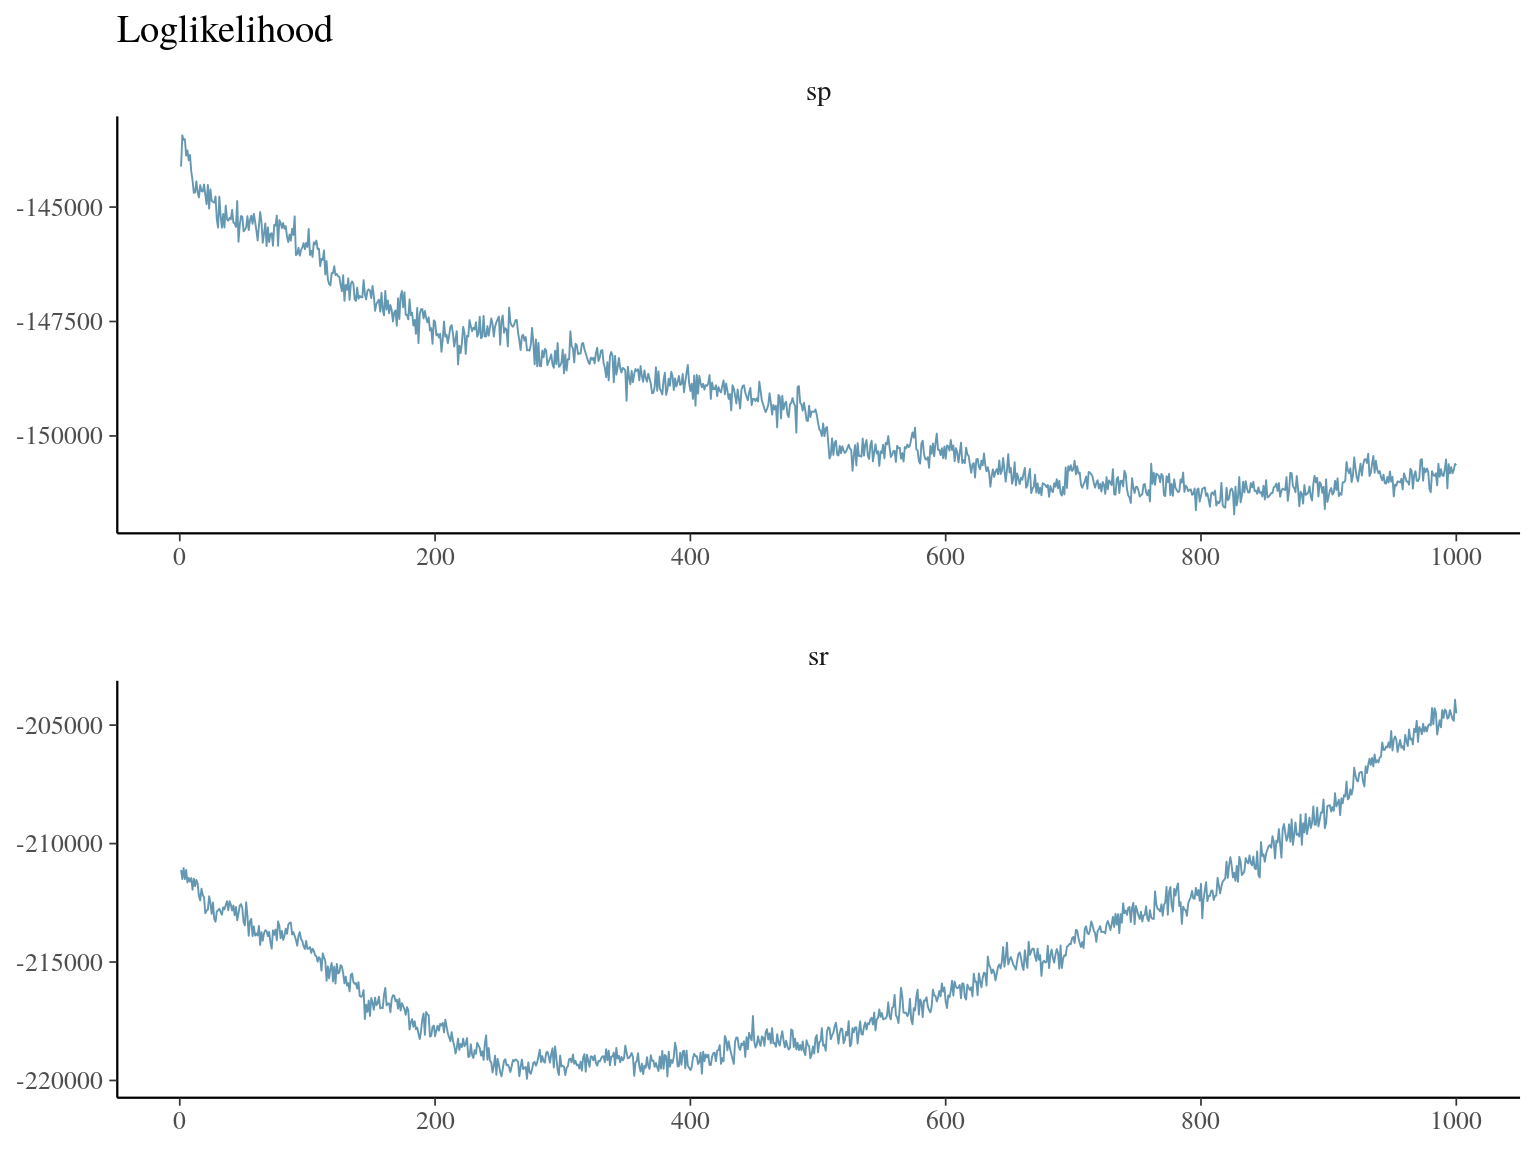
Figure 23.3: bgc loglikelihood.
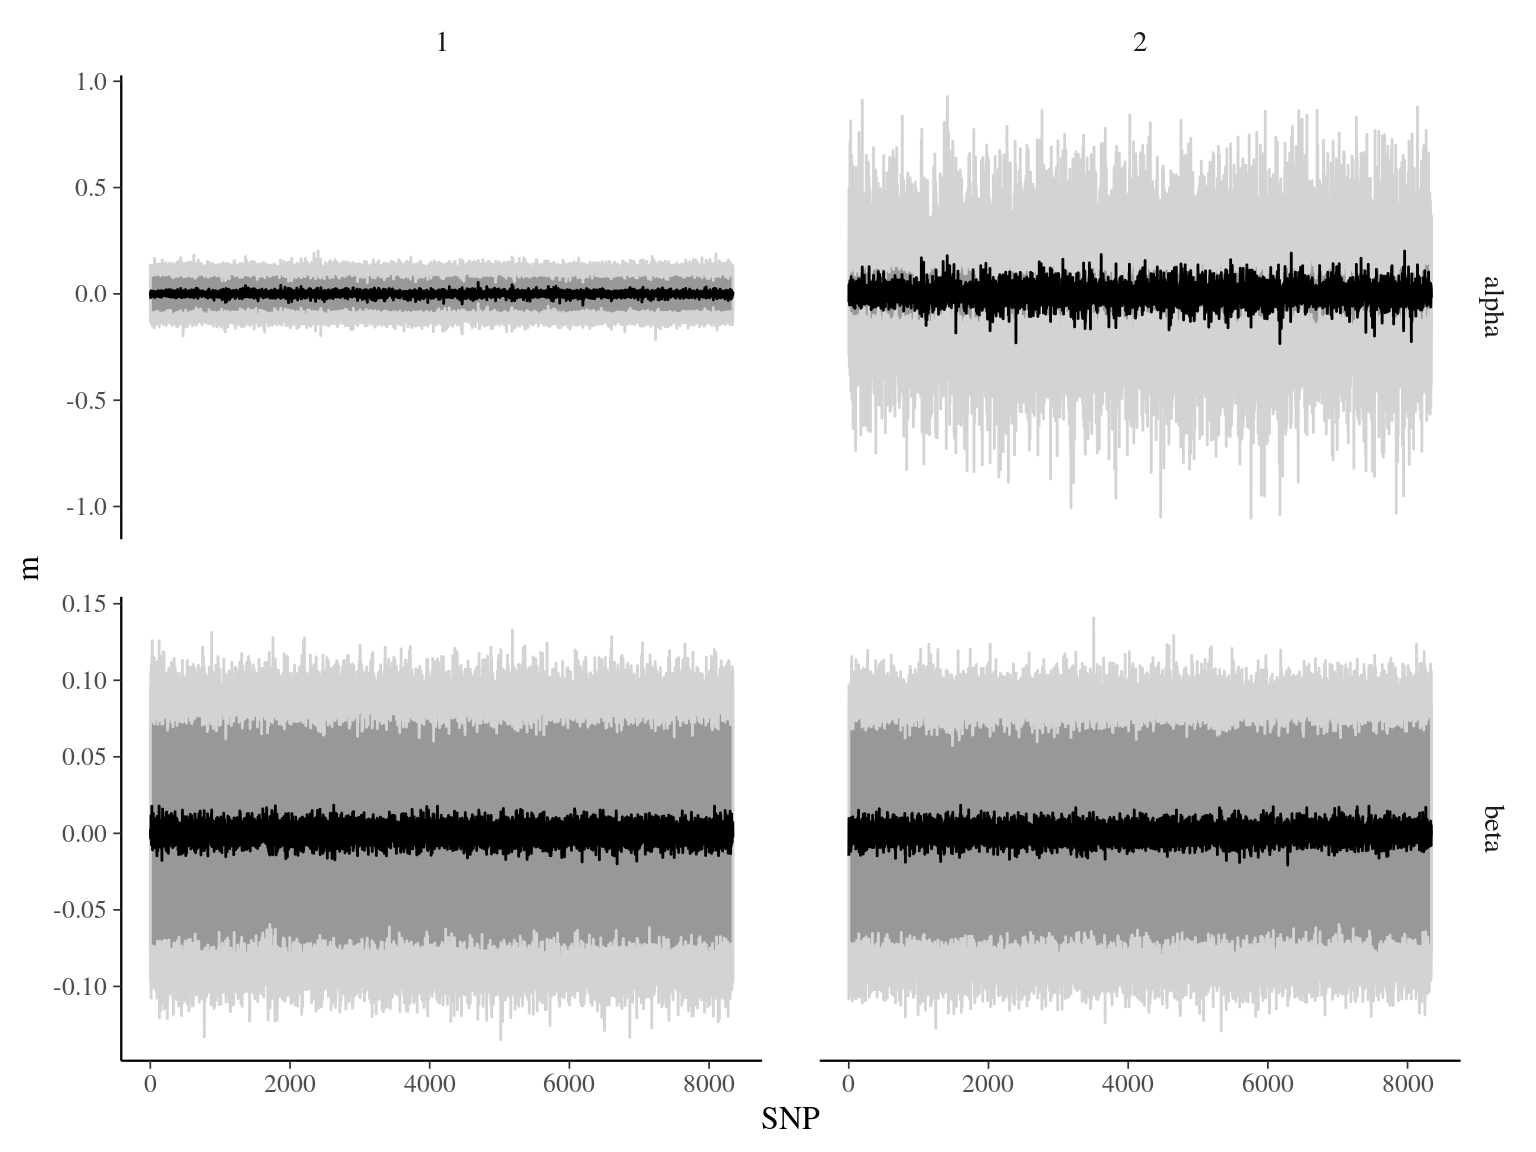
Figure 23.4: bgc \(\alpha\) and \(\beta\) parameters.
23.4 Environment
Introgression of S. sp1 within S. globulifera Paracou, allowed introgressed S. globulifera Paracou individuals to reach drier habitats (TWI < 3) of S. sp1, but not the introgression of S. globulifera Regina in S. sp1 (Fig. 23.5). Admixed didn’t show any specific patterns, and the pattern is similar but less clear for competition (NCI). Nevertheless, scatter plots (Fig. 23.6) suggested a positive relation between S. sp1 ancestry and tolerance to lower TWI, i.e. S. sp1 individuals introgressed with either S. globulifera Paracou or S. globulifera Regina seems to grow preferentially in wetter habitat.
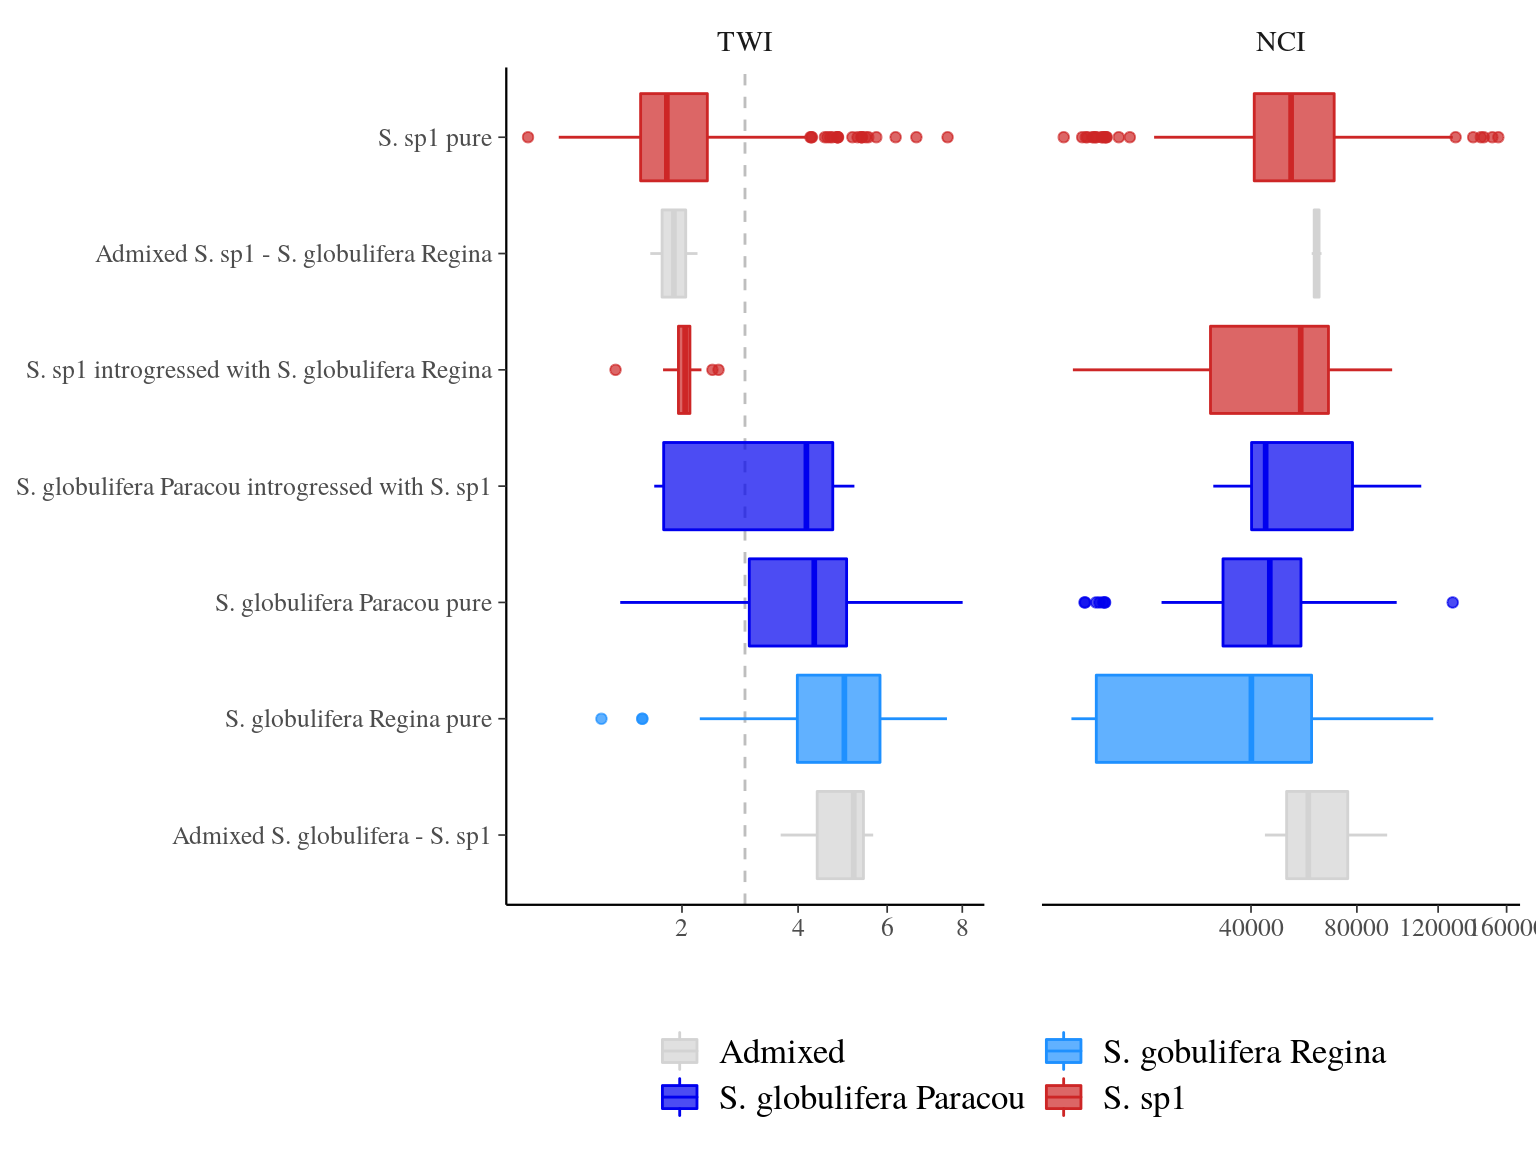
Figure 23.5: TWI and NCI distributions between pure-bred and admixed individuals per population.
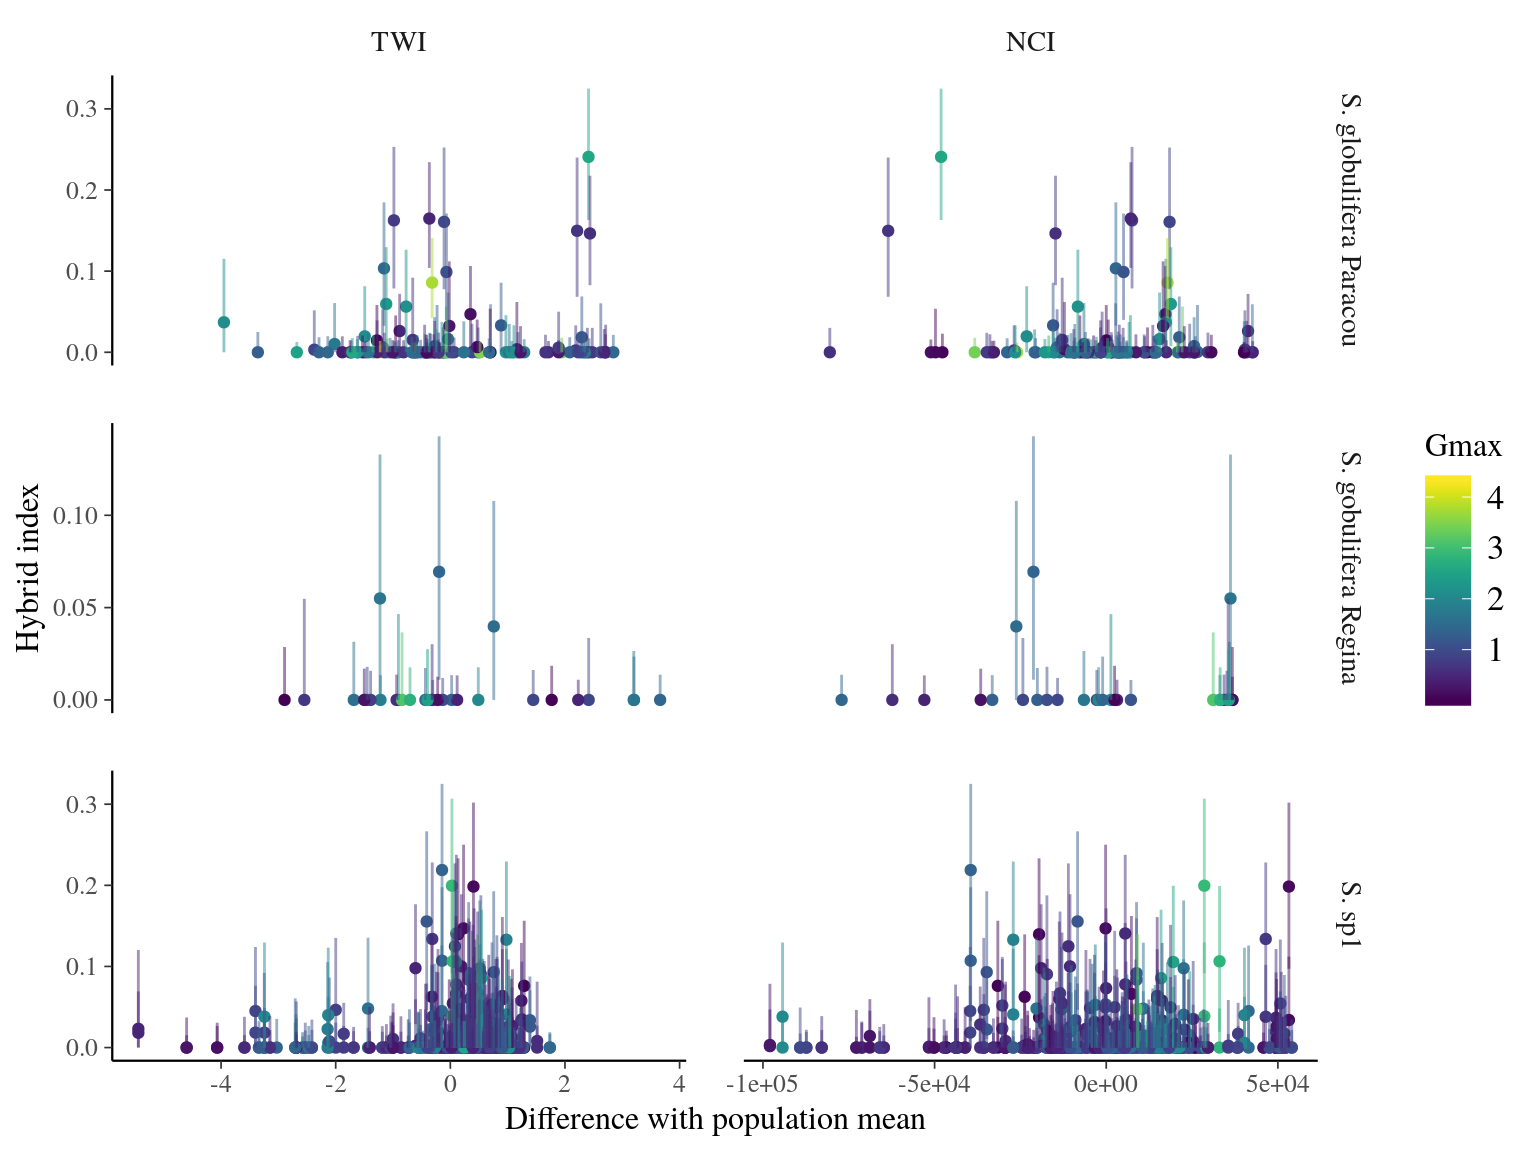
Figure 23.6: TWI and NCI vs hybrid index (S. sp1 ancestry) between population-pairs.
23.5 Growth
Admixed individuals between S. globulifera Paracou and S. sp1 seems to have an increased growth potential, but with a sample size of 3 it’s hard to say (Fig. 23.7). introgressed didn’t show any specific patterns. Scatter plots (Fig. 23.8) didn’t suggested anything specific.
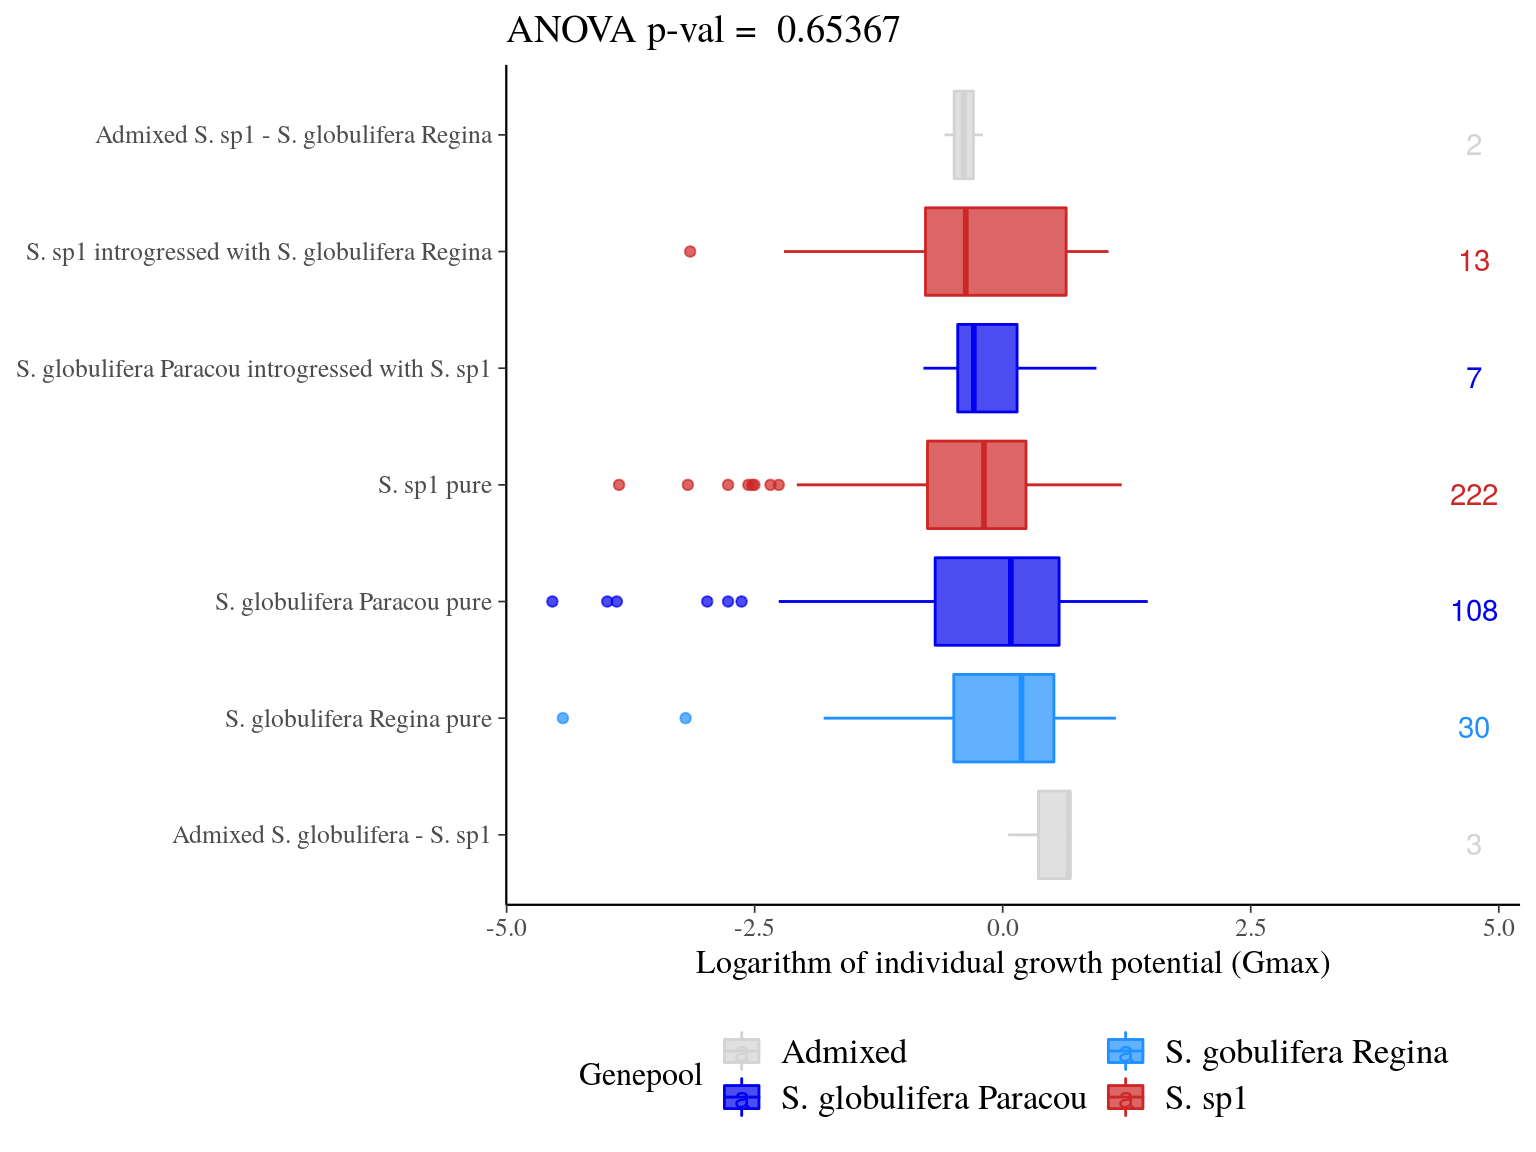
Figure 23.7: Individual growth potential (Gmax) distribution between pure-bred and admixed individuals per population.
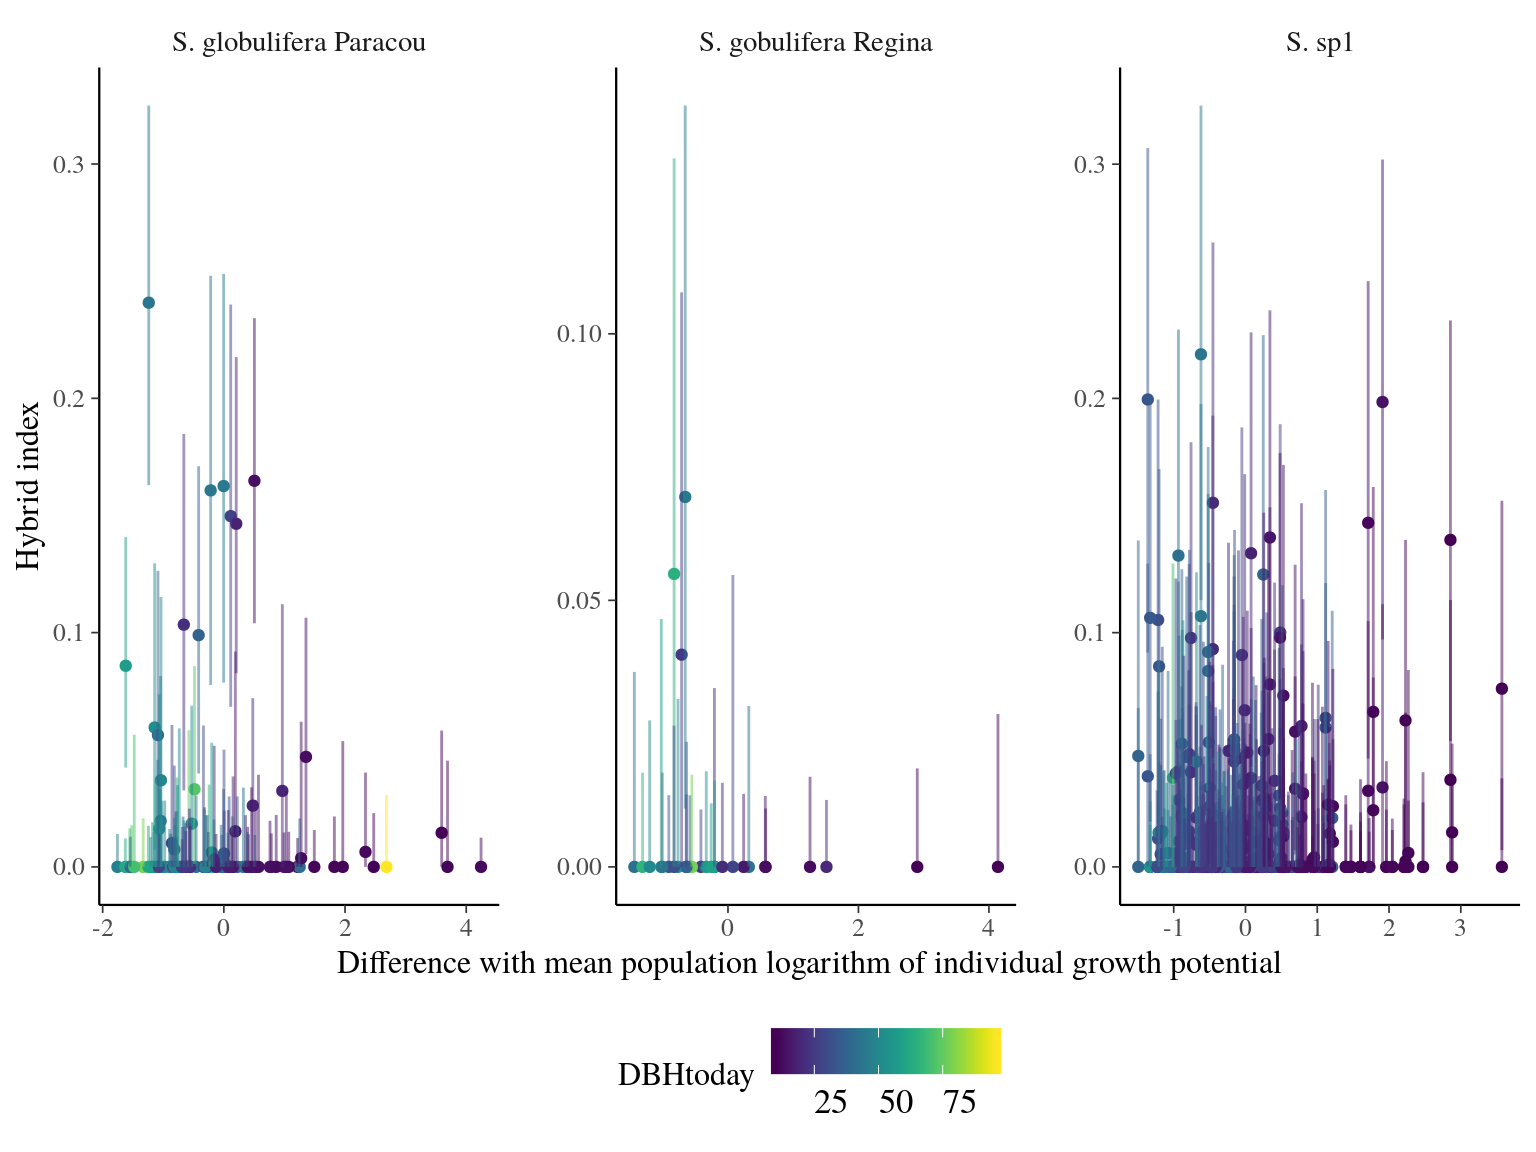
Figure 23.8: Individual growth potential (Gmax) and hybrid index (S. sp1 ancestry) between population-pairs.
References
Burgarella, C., Barnaud, A., Kane, N.A., Jankowski, F., Scarcelli, N., Billot, C., Vigouroux, Y. & Berthouly-Salazar, C. (2019). Adaptive introgression: An untapped evolutionary mechanism for crop adaptation. Frontiers in Plant Science, 10, 1–17.
Gompert, Z. & Alex Buerkle, C. (2010). Introgress: A software package for mapping components of isolation in hybrids. Molecular Ecology Resources, 10, 378–384.
Gompert, Z. & Buerkle, C.A. (2009). A powerful regression-based method for admixture mapping of isolation across the genome of hybrids. Molecular Ecology, 18, 1207–1224.
Hoban, S., Kelley, J.L., Lotterhos, K.E., Antolin, M.F., Bradburd, G., Lowry, D.B., Poss, M.L., Reed, L.K., Storfer, A. & Whitlock, M.C. (2016). Finding the genomic basis of local adaptation: Pitfalls, practical solutions, and future directions. American Naturalist, 188, 379–397.
Pfeifer, B., Alachiotis, N., Pavlidis, P. & Schimek, M.G. (2019). Genome Scans for Selection and Introgression based on k-nearest Neighbor Techniques. bioRxiv, 752758. Retrieved from https://www.biorxiv.org/content/10.1101/752758v2
Pfeifer, B. & Kapan, D.D. (2019). Estimates of introgression as a function of pairwise distances. BMC Bioinformatics, 20, 207. Retrieved from https://bmcbioinformatics.biomedcentral.com/articles/10.1186/s12859-019-2747-z
Racimo, F., Marnetto, D. & Huerta-Sánchez, E. (2016). Signatures of Archaic Adaptive Introgression in Present-Day Human Populations. Molecular Biology and Evolution, 34, msw216. Retrieved from https://academic.oup.com/mbe/article-lookup/doi/10.1093/molbev/msw216