Chapter 11 Quality Check
We received demultiplexed libraries from sequencing. We will then check sequences quality combining already produced fastqc and compare them with originally furnished (i) baits, (ii) targets, and (iii) references:
- Multi Quality Check: we used
multiqcto combinedfastqciuputs for every library (1002 for forward and reverse individuals) and check sequences, counts, quality and GC content - Trimming: we trimmed sequences removing bad quality and adaptors sequences
- Targets mapping: we mapped 10 libraries on targets to check of-targets sequences
- Reference mapping: we mapped 10 libraries on hybrid reference to check of-reference sequences, and assess de novo usefulness
11.1 Multi Quality Check
We used multiqc to combined fastqc iutputs for every library (1002 for forward and reverse individuals) and chech sequences, counts, quality and GC content.
cd ~/Documents/BIOGECO/PhD/data/Eschweilera_Paracou/Sequences/quality
multiqc fastqc
mkdir multiqc
mv multiqc_data/ multiqc_report.html L1.fastqc.tar.gz L2.fastqc.tar.gz multiqc
11.1.1 Counts
We have a big heterogeneity of sapmle representativity (215 000 folds), but 85% of samples have more than 66 6667 sequences (ca 1M targets / 150 bp * 10X). Moreover duplicated sequences are obviously more present in overrepresentated individuals, probably more linked to PCR biased than sequencing issues.
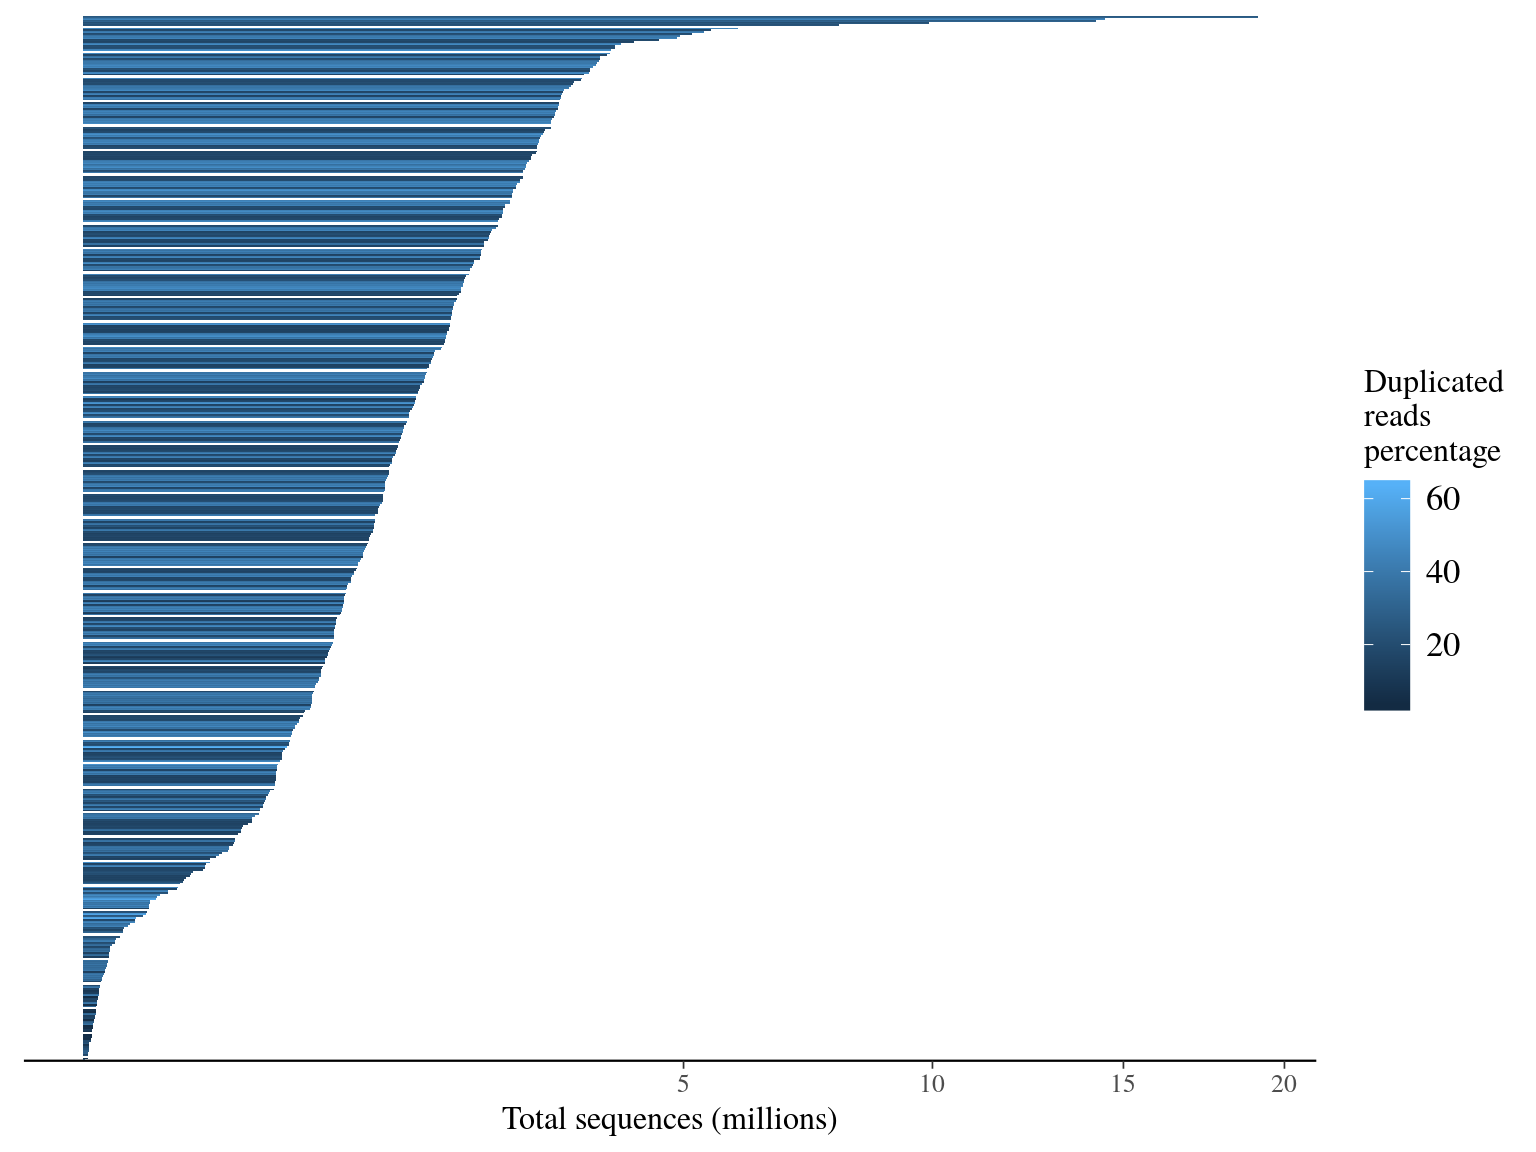
Figure 11.1: Sequence counts.
11.1.2 Quality
Sequences quality are very good as the Phred score is above 25 for every bases on all positions across all sequences !

Figure 11.2: Phred score.
11.1.3 GC content
The mean GC content is 41.5 and only few sequences have non expected global content or content across the sequence.
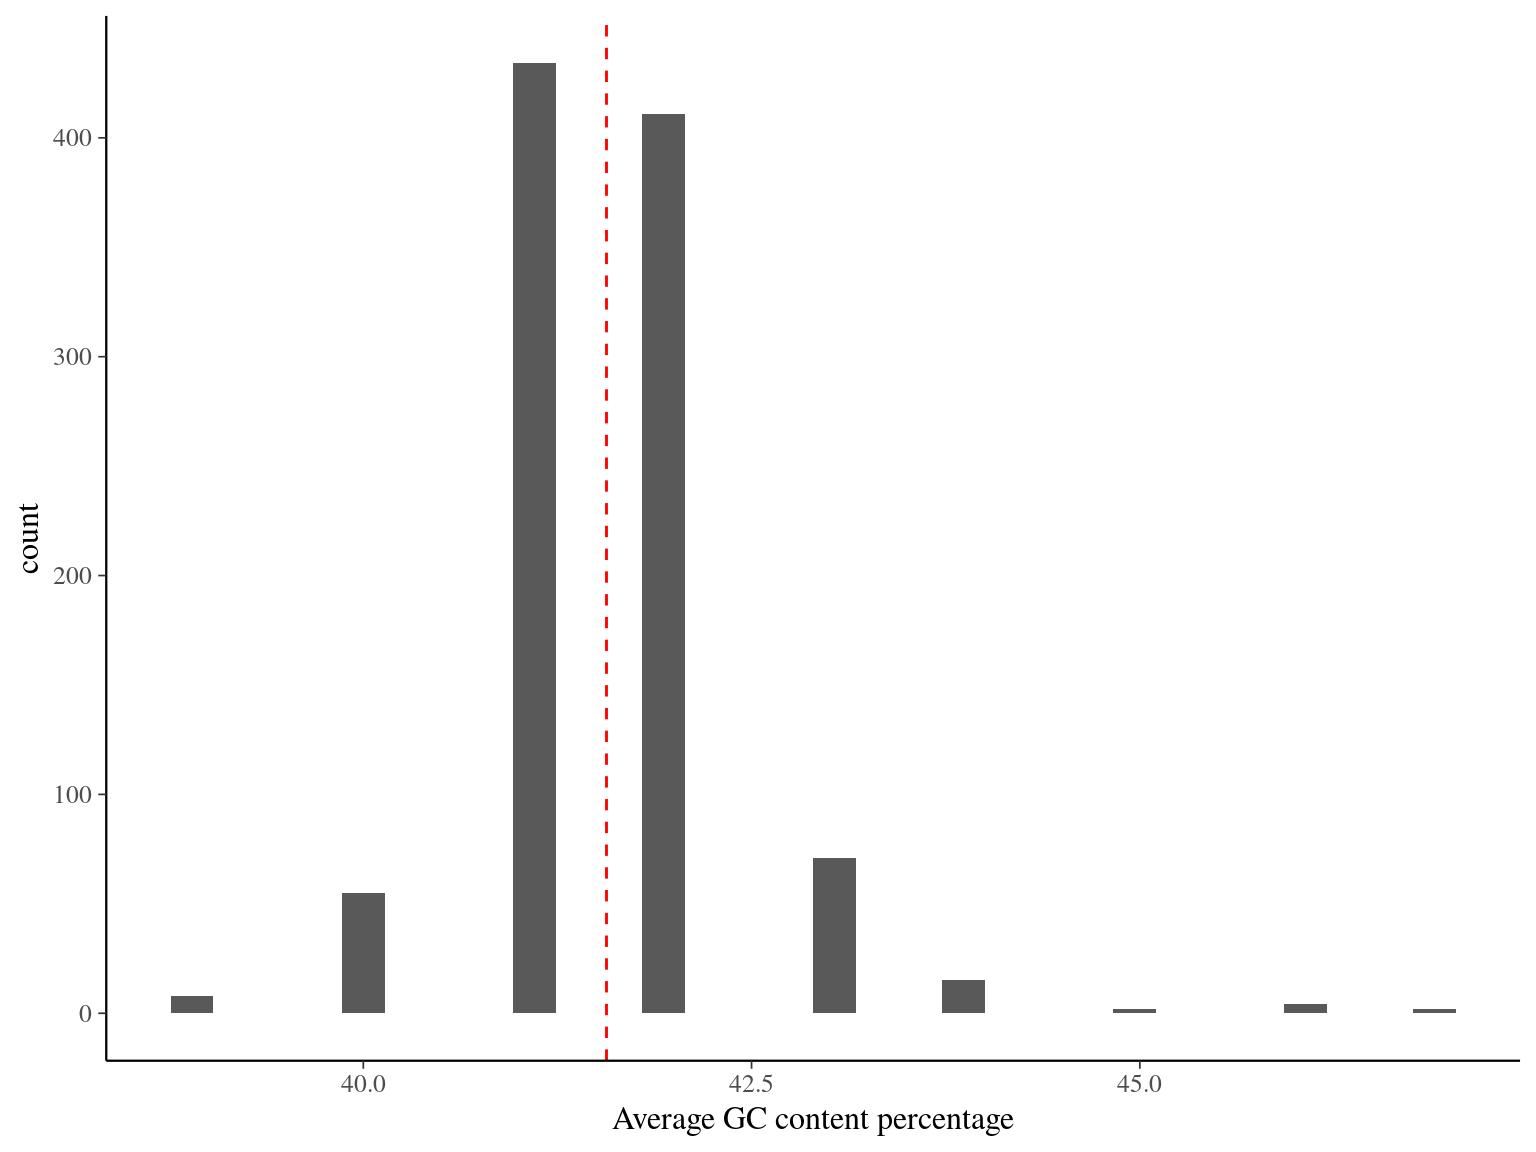
Figure 11.3: GC content across sequences.

Figure 11.4: GC content within sequences.
11.2 Trimming
We listed all libraries in a txt files and trimmed all libraries with trimmomatic in pair end (PE) into paired and unpaired compressed fastq files (fq.gz). We trimmed the adaptor (ILLUMINACLIP) of our protocol (TruSeq3-PE) with a seed mismatches of 2 (mismatched count allowed), a threshold for clipping palindrome of 30 (authorized match for ligated adapters), a threshold for simple clip of 10 (match between adapter and sequence), a minimum adaptor length of 2, and keeping both reads each time (keepBothReads). We trimmed sequences on phred score with a minimum of 15 in sliding window of 4 (SLIDINGWINDOW:4:15) without trimming the beginning (LEADING:X) or the end (TRAILING:X). Without surprise due to the high quality check of sequencing, trimming resulted in 99.91% of paired trimmed reads compared to raw reads (11.5). Thus the main issue of our dataset for now is more the representativity of sequences mor than their quality.
data.frame(libraries = list.files(file.path(path, "Sequences", "raw"))) %>%
  mutate(libraries = gsub("_R[12].fastq.gz", "", libraries)) %>%
  unique() %>%
write_tsv(path = file.path(path, "Sequences", "libraries.txt"), col_names = F)read_tsv(file.path(path, "Sequences", "libraries.txt"), col_names = "Library") %>%
sample_n(10) %>%
write_tsv(path = file.path(path, "Sequences", "libraries_mapping.txt"), col_names = F)#!/bin/bash
#SBATCH --time=36:00:00
#SBATCH -J trimming
#SBATCH -o trimming_output.out
#SBATCH -e trimming_error.out
#SBATCH --mem=20G
#SBATCH --cpus-per-task=1
#SBATCH --mail-type=BEGIN,END,FAIL
module load bioinfo/Trimmomatic-0.36
for library in $(cat libraries.txt)
do
java -jar $TRIM_HOME/trimmomatic.jar PE \
raw/"$library"_R1.fastq.gz raw/"$library"_R2.fastq.gz \
trimmed/paired/"$library"_R1_paired.fq.gz trimmed/unpaired/"$library"_R1_unpaired.fq.gz \
trimmed/paired/"$library"_R2_paired.fq.gz trimmed/unpaired/"$library"_R2_unpaired.fq.gz \
ILLUMINACLIP:TruSeq3-PE.fa:2:30:10:2:keepBothReads \
SLIDINGWINDOW:4:15
done
cat trimmed/paired_stat.txt
for file in $(ls trimmed/paired)
do
zcat trimmed/paired/$file | echo $file" "$((`wc -l`/4)) >> trimmed/paired_stat.txt
done
cat trimmed/unpaired_stat.txt
for file in $(ls trimmed/unpaired)
do
zcat trimmed/unpaired/$file | echo $file" "$((`wc -l`/4)) >> trimmed/unpaired_stat.txt
done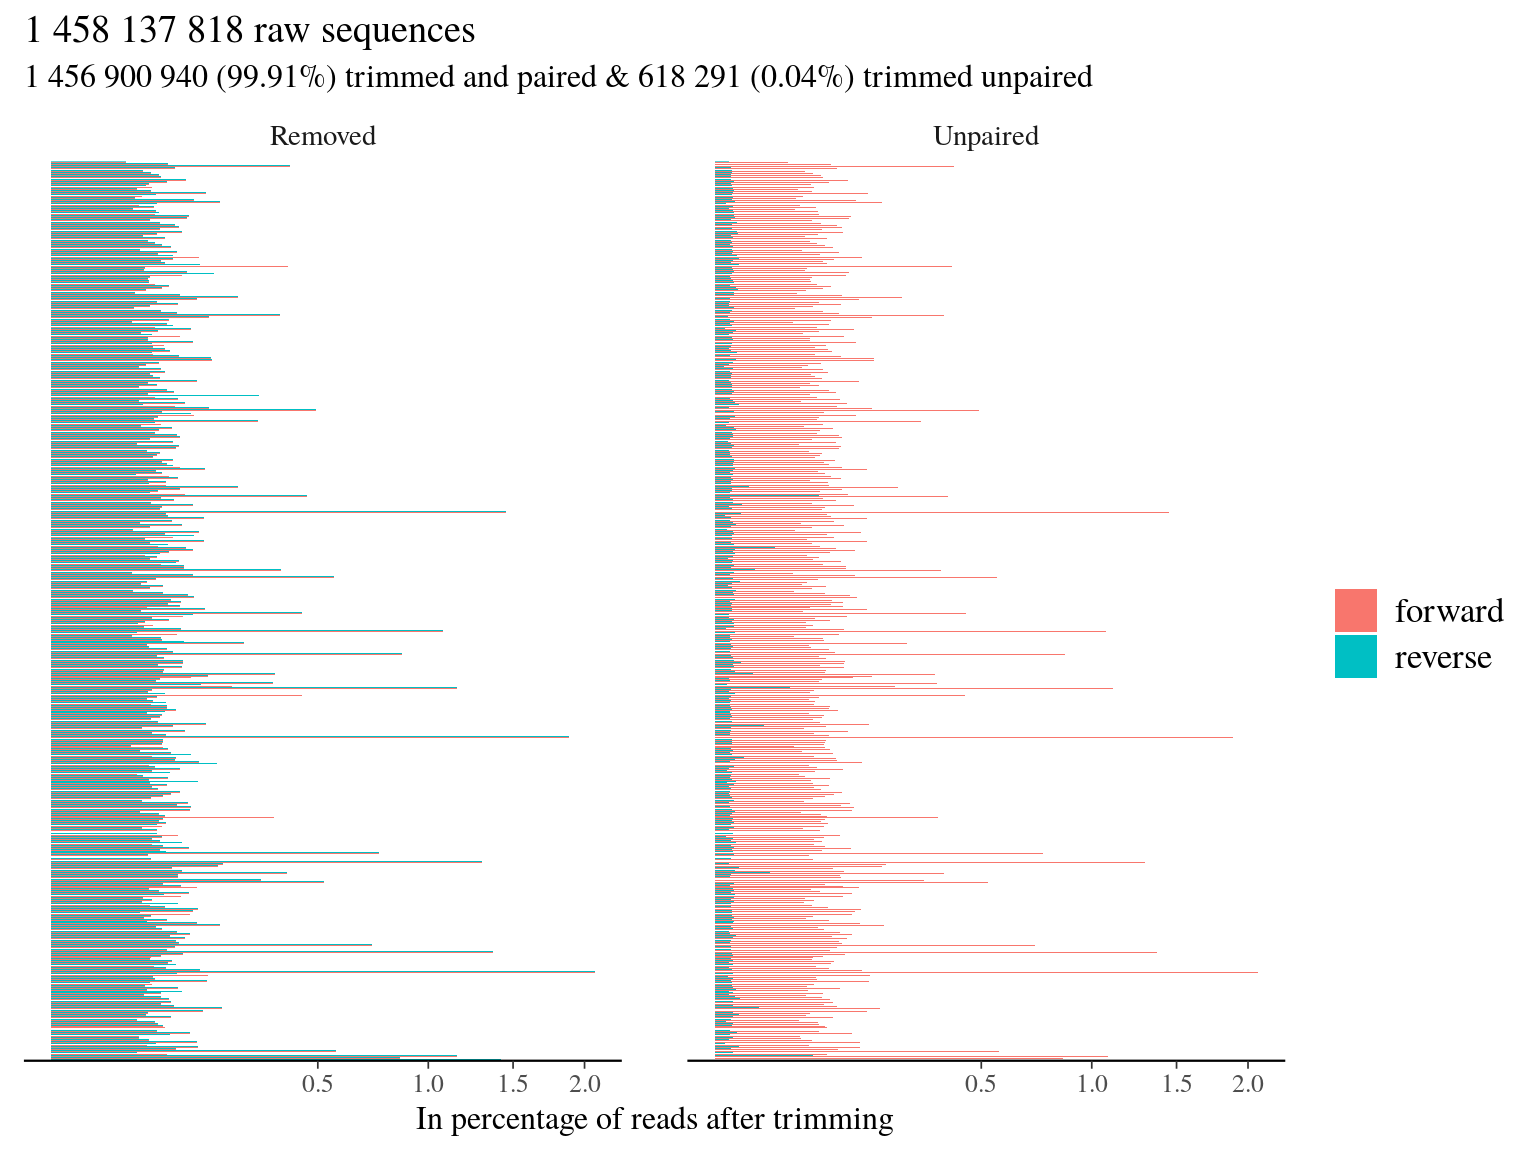
Figure 11.5: Trimming results.
11.3 Targets mapping
We mapped 10 libraries on targets to check of-targets sequences and targets loss. Globally we had a good coverage of targets (median of 90%, 11.6) but reads were 70% to 81% of-targets (11.1) ! Consequently we could not only use targets as reference for reads mapping.
#!/bin/bash
#SBATCH --time=36:00:00
#SBATCH -J targetsMapping
#SBATCH -o targetsMapping_output.out
#SBATCH -e targetsMapping_error.out
#SBATCH --mem=20G
#SBATCH --cpus-per-task=1
#SBATCH --mail-type=BEGIN,END,FAIL

module purge
module load bioinfo/bwa-0.7.15
module load bioinfo/picard-2.14.1
module load bioinfo/samtools-1.4
module load bioinfo/bedtools-2.26.0

targets=../Baits/files-Symphonia/target-sequences.fas
bwa index $targets
for library in $(cat libraries_mapping.txt)
do
  rg="@RG\tID:${library}\tSM:${library}\tPL:HiSeq4K"
  bwa mem -M -R "${rg}" -t 16 $targets trimmed/paired/"$library"_R1_paired.fq.gz trimmed/paired/"$library"_R2_paired.fq.gz > targetsMapping/sam/"${library}.sam"
  java -Xmx4g -jar $PICARD SortSam I=targetsMapping/sam/"${library}.sam" O=targetsMapping/bam/"${library}".bam SORT_ORDER=coordinate
  java -Xmx4g -jar $PICARD BuildBamIndex I=targetsMapping/bam/"${library}".bam O=targetsMapping/bam/"${filename}".bai
  samtools index targetsMapping/bam/"${library}".bam
  bedtools bamtobed -i =targetsMapping/bam/"${library}".bam > targetsMapping/bed/"${library}".bed
  bedtools merge -i targetsMapping/bed/"${library}".bed > targetsMapping/merged_bed/"${library}".bed
done
touch readsMappingStat.txt
for file in $(ls bam/*.bam)
do
  samtools flagstat $file | echo $file"   "$(grep "mapped (") >> readsMappingStat.txt
done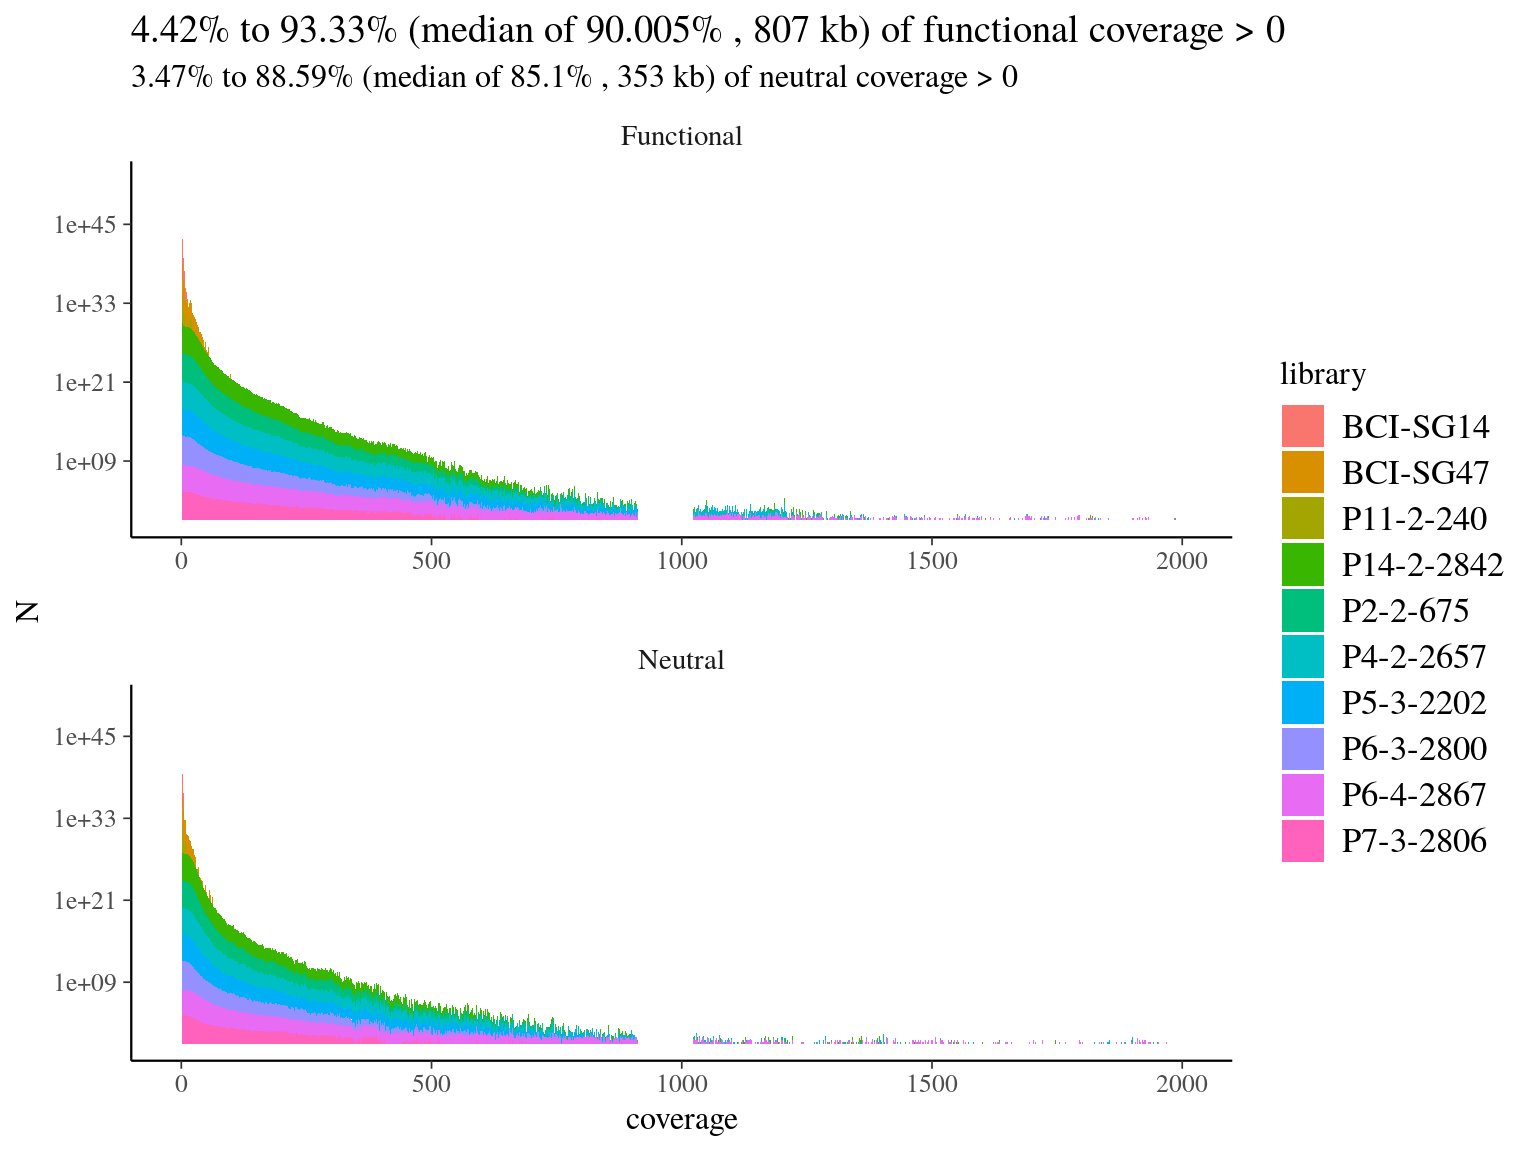
Figure 11.6: Reads alignment coverage on targets. Distribution has been cut at 2000X.
| Library | Reads mapped | Percentage of reads mapped |
|---|---|---|
| P7-3-2806 | 358925 | 28.22 |
| BCI-SG14 | 950 | 27.15 |
| BCI-SG47 | 16677 | 27.18 |
| P11-2-240 | 1064 | 19.25 |
| P14-2-2842 | 607526 | 23.85 |
| P2-2-675 | 499249 | 28.01 |
| P4-2-2657 | 784026 | 26.77 |
| P5-3-2202 | 722215 | 30.28 |
| P6-3-2800 | 474588 | 20.19 |
| P6-4-2867 | 1210288 | 19.31 |
| P7-3-2806 | 358925 | 28.22 |
11.4 Reference mapping
We mapped every libraries on hybrid reference to check of-reference sequences, and assess de novo usefulness. Globally we had a low coverage of the reference (median of 19%, 11.7) but reads were 79% to 88% on-reference (11.2) ! Finally, we had a median of 4Mb covered with 10X on reference, which is 4 times what we designed in probes. Consequently, we won’t need de novo assembly and will proceed to read mapping for every libraries on the built reference, already partly annotated.
#!/bin/bash
#SBATCH --time=36:00:00
#SBATCH -J referenceMapping
#SBATCH -o treferenceMapping_output.out
#SBATCH -e referenceMapping_error.out
#SBATCH --mem=20G
#SBATCH --cpus-per-task=1
#SBATCH --mail-type=BEGIN,END,FAIL

module purge
module load bioinfo/bwa-0.7.15
module load bioinfo/picard-2.14.1
module load bioinfo/samtools-1.4
module load bioinfo/bedtools-2.26.0

cat ../../Symphonia_Genomic/neutral_selection/merged.fasta > referenceMapping/reference.fasta
reference=referenceMapping/reference.fasta
bwa index $reference
for library in $(cat libraries_mapping.txt)
do
  rg="@RG\tID:${library}\tSM:${library}\tPL:HiSeq4K"
  bwa mem -M -R "${rg}" -t 16 $reference trimmed/paired/"$library"_R1_paired.fq.gz trimmed/paired/"$library"_R2_paired.fq.gz > referenceMapping/sam/"${library}.sam"
  java -Xmx4g -jar $PICARD SortSam I=referenceMapping/sam/"${library}.sam" O=referenceMapping/bam/"${library}".bam SORT_ORDER=coordinate
  java -Xmx4g -jar $PICARD BuildBamIndex I=referenceMapping/bam/"${library}".bam O=referenceMapping/bam/"${filename}".bai
  samtools index targetsMapping/bam/"${library}".bam
  bedtools bamtobed -i =referenceMapping/bam/"${library}".bam > referenceMapping/bed/"${library}".bed
  bedtools merge -i referenceMapping/bed/"${library}".bed > referenceMapping/merged_bed/"${library}".bed
done
touch readsMappingStat.txt
for file in $(ls bam/*.bam)
do
  samtools flagstat $file | echo $file"   "$(grep "mapped (") >> readsMappingStat.txt
done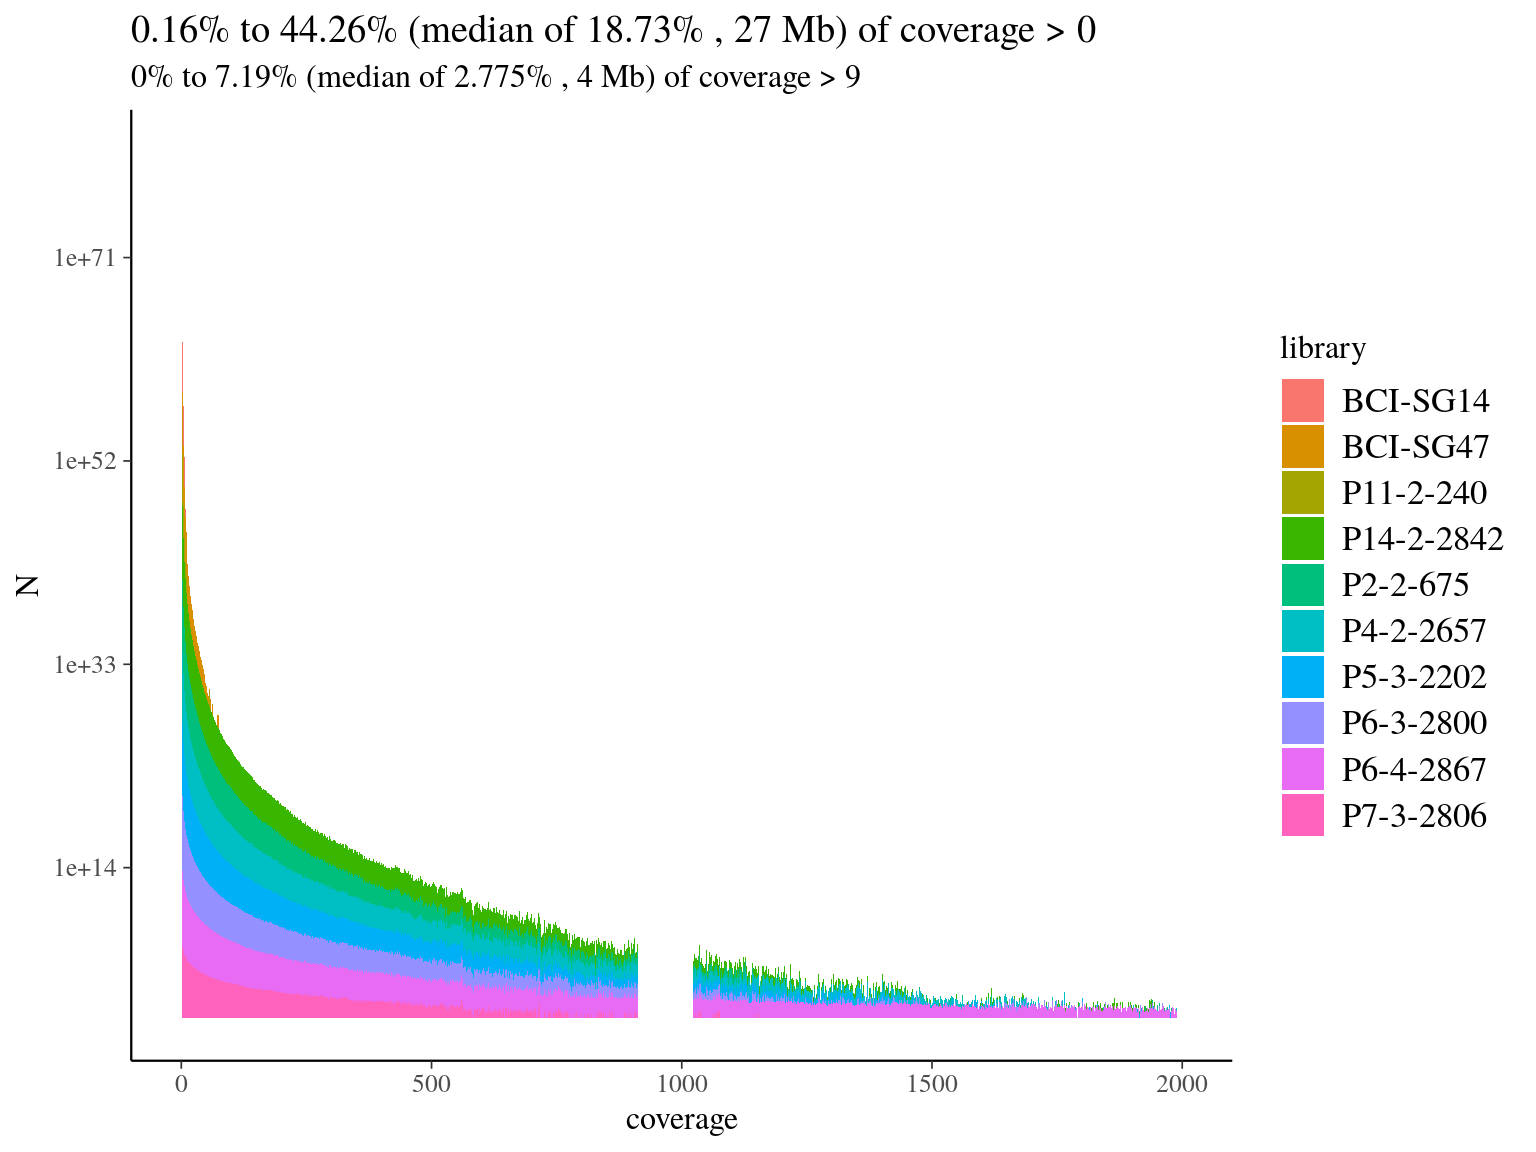
Figure 11.7: Reads alignment coverage on reference. Distribution has been cut at 2000X.
| Library | Reads mapped | Percentage of reads mapped |
|---|---|---|
| BCI-SG14 | 3232 | 85.28 |
| BCI-SG47 | 57142 | 85.57 |
| P11-2-240 | 4669 | 78.74 |
| P14-2-2842 | 2384919 | 85.85 |
| P2-2-675 | 1684774 | 86.47 |
| P4-2-2657 | 2717886 | 85.82 |
| P5-3-2202 | 2276779 | 87.75 |
| P6-3-2800 | 2161522 | 84.74 |
| P6-4-2867 | 5707686 | 83.93 |
| P7-3-2806 | 1153783 | 83.91 |